
Redmond's latest detached-home snapshot gives buyers fresh choices and sellers a reason to keep an eye on pricing. NWMLS recorded 20 newly active listings, 9 pending events and 19 price reductions in the seven-day Market Watch view. The broader monthly Residential figures add context: more homes were listed for sale than a year earlier, while the median price of September's closed sales was lower. Those are useful signals for a conversation about your specific home, not a shortcut to valuing every property.
Seven-Day Redmond Detached-Home Activity
This snapshot uses NWMLS's 7 Day Market Watch setting, with the exact MLS city field “Redmond,” King County, and the verified detached-home styles. Attached and zero-lot-line homes are excluded. No price or neighborhood restriction is applied. An MLS city field may differ from municipal boundaries.
The source query starts October 9, 2026 (“10/9/2026+”) and runs through collection on October 16 at 11:29 a.m. PDT. The source does not expose an exact cutoff or boundary convention.
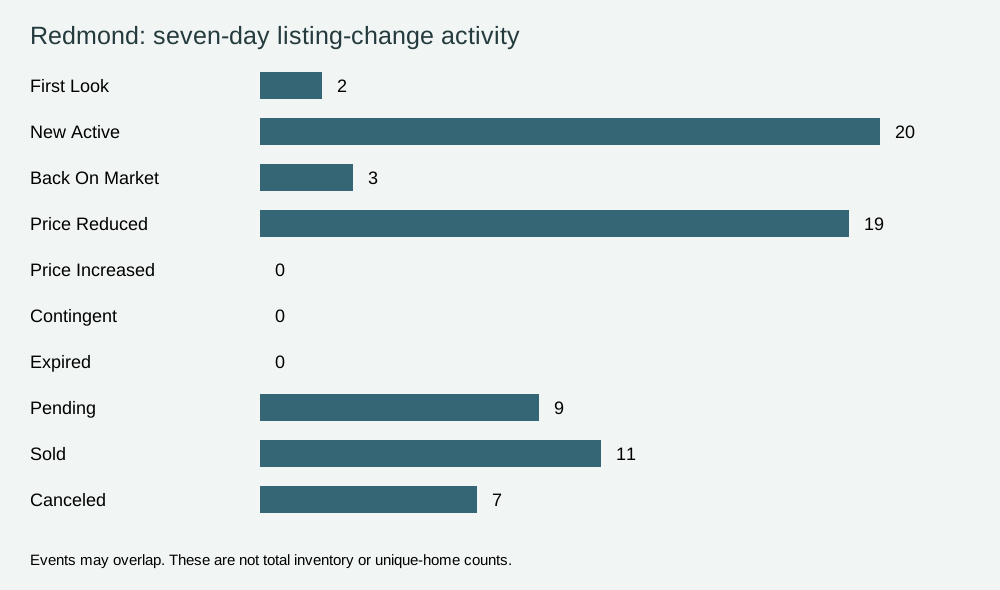
Activity | Count |
|---|---|
First Look | 2 |
New Active | 20 |
Back On Market | 3 |
Price Reduced | 19 |
Price Increased | 0 |
Contingent | 0 |
Expired | 0 |
Pending | 9 |
Sold | 11 |
Canceled | 7 |
Reading The Activity
The 19 reductions are close to the 20 newly active events, but they may involve some of the same homes. They are not a measure of how many sellers cut prices overall. Nine pending events and 11 sold events show different stages of transactions; subtracting them from newly active listings would not measure inventory change.
First Look is an early MLS view of listings. Current public availability may differ from the status recorded at collection. No prior-week change is shown because a verified adjacent, equal-duration comparison window is not available.
The Monthly Picture
Median sale price and average days on market describe homes that closed during the reporting month, not homes still listed for sale. For those sold homes, days on market measures the time from listing to offer acceptance.
Metric | Sep 2025 | Aug 2026 | Sep 2026 | YoY | MoM |
|---|---|---|---|---|---|
Median sale price (sold homes) | $1,532,500 | $1,462,900 | $1,399,999 | -8.6% | -4.3% |
New listings | 82 | 102 | 137 | +67.1% | +34.3% |
Homes for sale | 142 | 207 | 236 | +66.2% | +14.0% |
Pending sales | 58 | 66 | 49 | -15.5% | -25.8% |
Closed sales | 60 | 49 | 65 | +8.3% | +32.7% |
Average days on market (sold homes) | 29 | 33 | 35 | +20.7% | +6.1% |
Months supply (closed-sales measure) | 2.4 | 4.2 | 4.7 | +95.8% | +11.9% |
September's Residential median sale price was $1,399,999: -4.3% month over month and -8.6% year over year. Changes in the mix of homes sold can move a median; these percentages do not establish the change in value of an individual home.
Homes for sale rose to 236, while pending sales totaled 49. The closed-sales supply measure was 4.7 months. Together these measures help describe the choices and pace buyers encountered, but each property's price, condition and location still matter.
Twelve Months Of Residential Trends
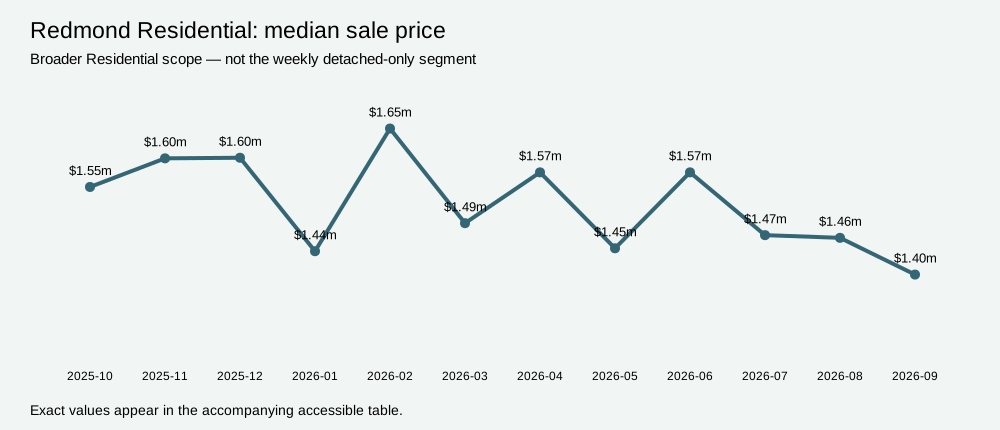
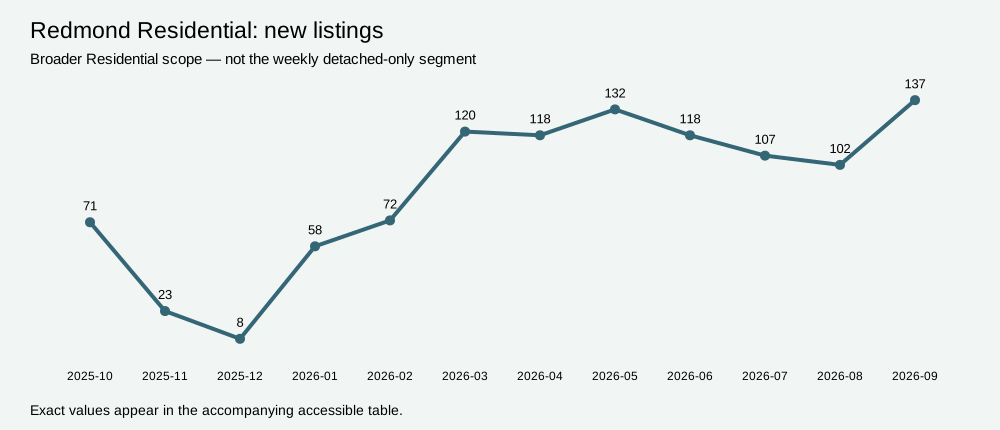
Month | Median sale price (sold homes) | New listings |
|---|---|---|
2025-10 | $1,550,000 | 71 |
2025-11 | $1,599,000 | 23 |
2025-12 | $1,600,000 | 8 |
2026-01 | $1,440,000 | 58 |
2026-02 | $1,650,000 | 72 |
2026-03 | $1,488,000 | 120 |
2026-04 | $1,575,000 | 118 |
2026-05 | $1,445,000 | 132 |
2026-06 | $1,575,000 | 118 |
2026-07 | $1,467,500 | 107 |
2026-08 | $1,462,900 | 102 |
2026-09 | $1,399,999 | 137 |
What This Means For Buyers
Compare the homes that fit your location, layout and budget, including listings with price adjustments. Look closely at condition, inspection findings and total ownership costs. More choice can give you room to be selective, but a well-matched home can still attract competition.
What This Means For Sellers
Build your pricing plan around nearby competing listings and relevant recent closed sales. Watch showing feedback and new alternatives after launch. Preparation, presentation and a realistic asking price work together; a citywide median is a starting point for context, not a property valuation.
Explore The Listing Register
The register includes First Look and newly active records once per MLS ID. Public links were checked on October 16, 2026 against the exact MLS ID. Team NSRG is used first, with Redfin fallback for First Look. Unresolved records remain explicit; a same-address listing with a different MLS number is not substituted.
MLS ID | Address | Source category | Public link / coverage |
|---|---|---|---|
2592542 | 9151 227th Ave NE | First Look | |
2593399 | 13771 NE 76th Place | First Look | |
2590545 | 17022 NE 133rd St | New Active | |
2594497 | 11579 157th CT NE | New Active | |
2591294 | 16321 NE 98th Street | New Active | |
2593923 | 2614 176th Place NE | New Active | |
2593574 | 3211 W Ames Lake Dr NE | New Active | |
2593671 | 21007 NE 117th St | New Active | |
2593205 | 14223 NE 66th St | New Active | |
2592499 | 12203 235th Place NE | New Active | |
2593242 | 10323 133rd Ct NE | New Active | |
2593247 | 9731 228th Terr NE | New Active | |
2593183 | 7003 134th Ave NE | New Active | |
2591757 | 9111 183rd Ct NE | New Active | |
2592292 | 11508 165th Ct NE | New Active | |
2593008 | 606 278th Ave NE | New Active | |
2589434 | 5928 160th Ct NE | New Active | |
2591193 | 12385 166th Ct NE | New Active | |
2592675 | 7709 216th Ave NE | New Active | |
2591128 | 6419 225th Ave NE | New Active | |
2593009 | 9463 221st Place NE | New Active | |
2592903 | 12724 Sunbreak Wy NE | New Active |
Let's Talk About Your Plans
As we navigate these market changes together, my goal is for these updates to give you an increasingly clear picture of local trends. Buying and selling real estate takes an in-depth understanding of current conditions and where the market is heading. I'm here to help you make sense of both. My phone is always on, and I love to talk shop. Don't hesitate to reach out with your questions.
Jeremy Minor | Team NSRG | [email protected] | 206-349-9748