

TEAM NSRG | NOVEMBER 5, 2026
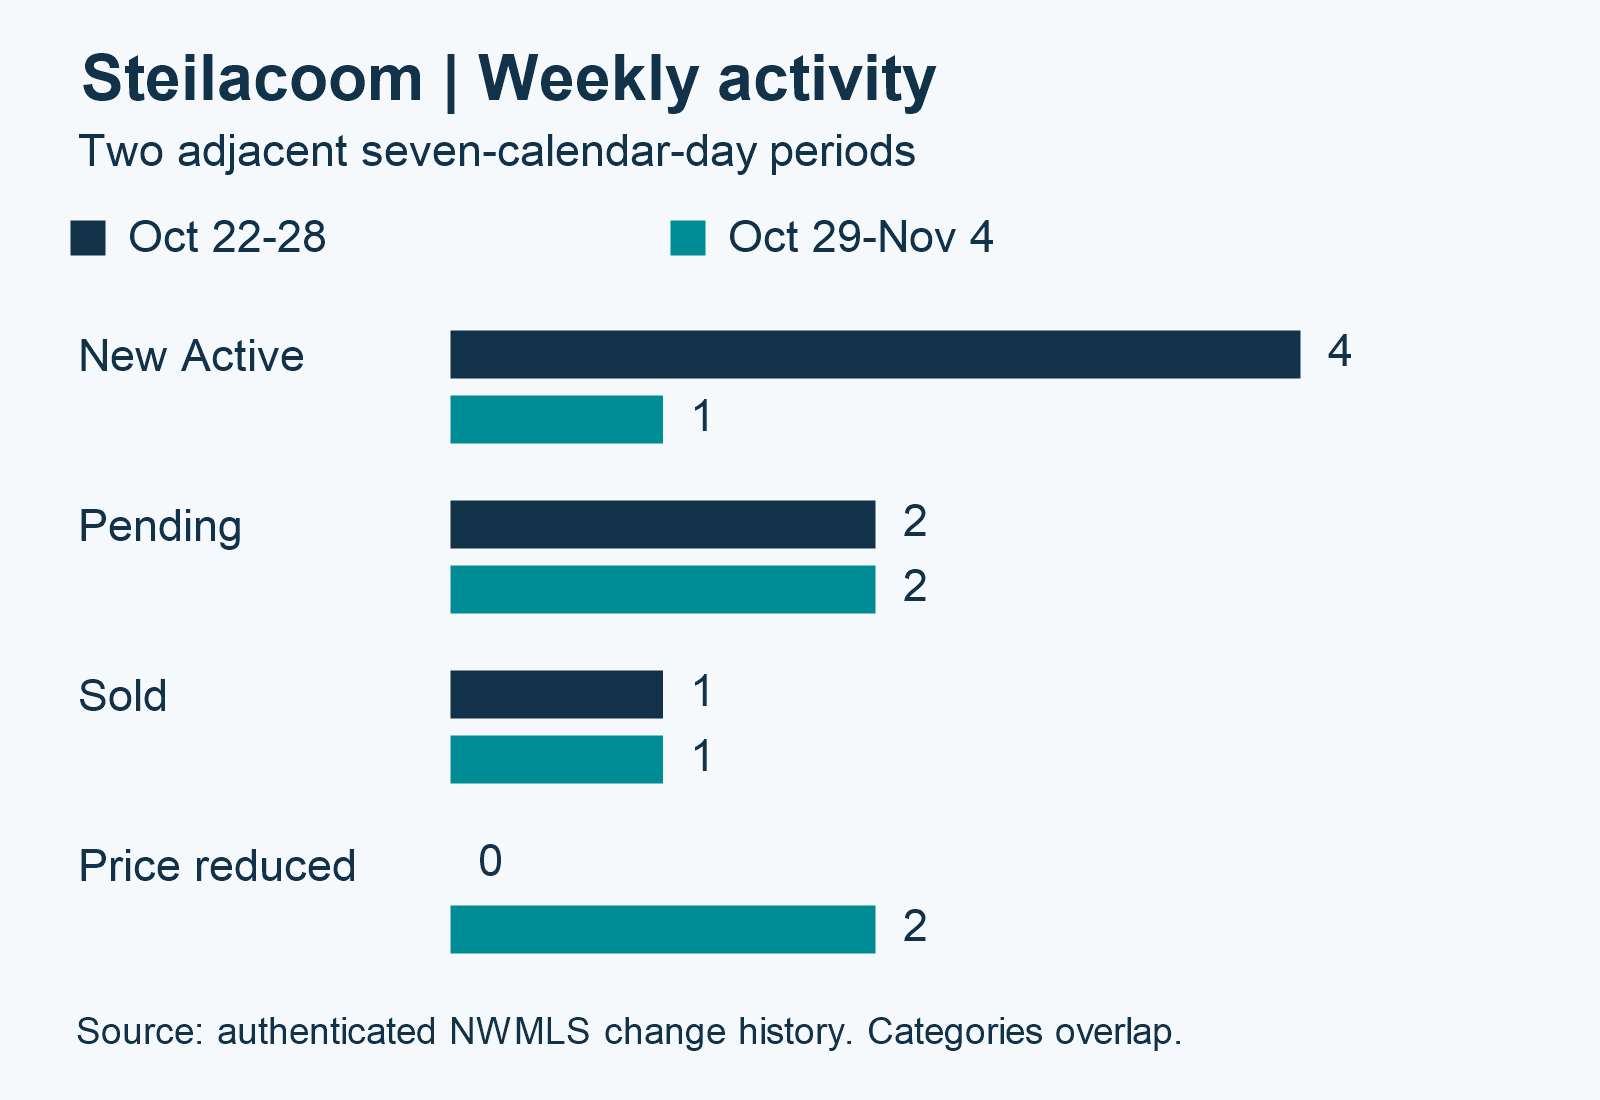
Detached-home activity for October 29-November 4, compared with October 22-28.
What changed this week
Steilacoom’s pending and sold activity held steady, while fewer homes became Active and a couple of sellers adjusted their prices. With so few transactions, the properties behind those changes matter more than a sweeping market label.
What it means for your next move
Buyers should review each available home on its own merits and ask about the reason for any price adjustment. Sellers can focus on presentation and the closest comparable properties rather than treating a one-week change in a small market as a lasting trend.
October price context
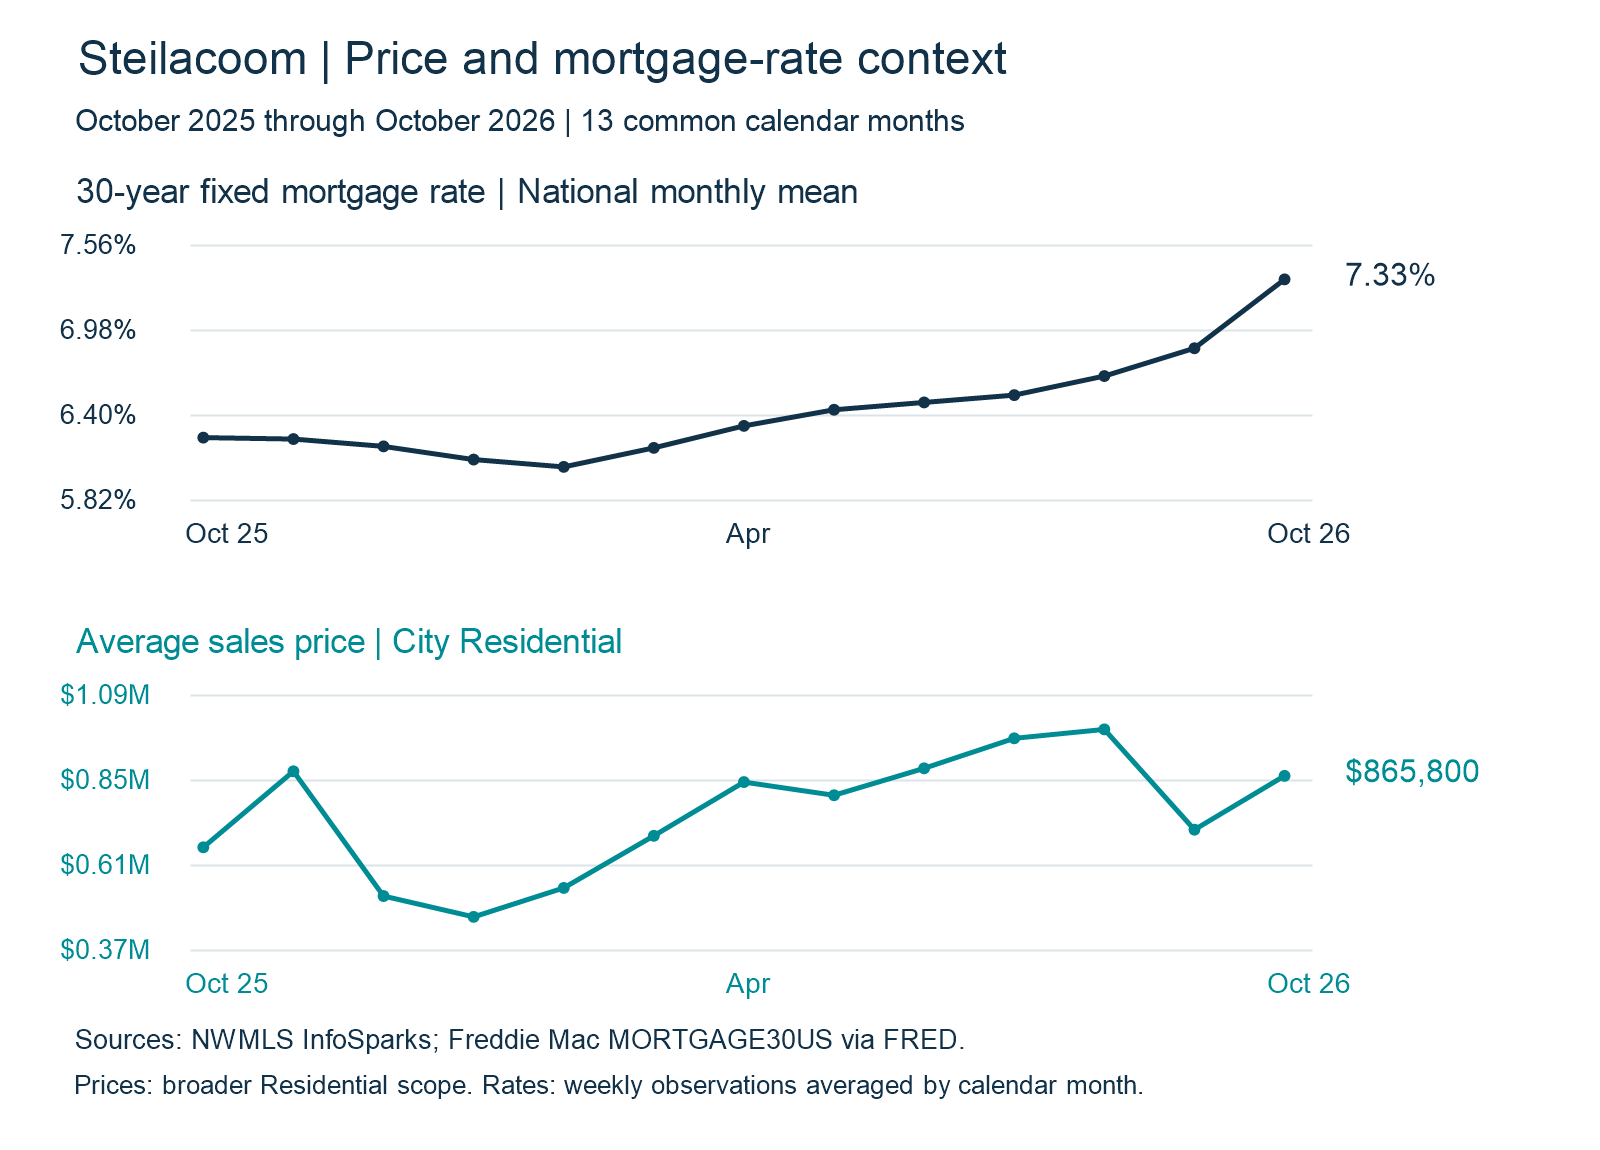
InfoSparks reports an October 2026 average sales price of $865,800 for Steilacoom Residential properties. This monthly series covers a broader Residential group than the detached-only weekly activity above. An average can shift with the mix of homes that close; it is not an estimate of an individual home's value.
Thirteen months in context
October's average sales price was 30.5% higher than October 2025 and 21.4% higher than September 2026. The national monthly mortgage-rate mean was 7.33%, compared with 6.86% in September. These separate series provide context; their movement does not establish that one caused the other.
Mortgage-rate snapshot for November 5, 2026
November 5, 2026. Dated national index, not a live widget or personalized quote.
Product | Rate |
|---|---|
30-year fixed | 7.17% |
Daily change from November 4: −0.05 percentage points.
View live Mortgage News Daily rates · View daily rate movement
See exact monthly rates and average sales prices
Month | 30-year fixed rate |
|---|---|
October 2025 | 6.25% |
November 2025 | 6.24% |
December 2025 | 6.19% |
January 2026 | 6.10% |
February 2026 | 6.05% |
March 2026 | 6.18% |
April 2026 | 6.33% |
May 2026 | 6.44% |
June 2026 | 6.49% |
July 2026 | 6.54% |
August 2026 | 6.67% |
September 2026 | 6.86% |
October 2026 | 7.33% |
Month | Average sales price |
|---|---|
October 2025 | $663,300 |
November 2025 | $878,733 |
December 2025 | $525,000 |
January 2026 | $466,000 |
February 2026 | $548,113 |
March 2026 | $695,925 |
April 2026 | $848,200 |
May 2026 | $810,813 |
June 2026 | $887,143 |
July 2026 | $972,164 |
August 2026 | $997,500 |
September 2026 | $713,249 |
October 2026 | $865,800 |
Rates: arithmetic mean of Freddie Mac weekly MORTGAGE30US observations within each calendar month, percent, not seasonally adjusted, shown to two decimals. FRED series and Freddie Mac archive. Prices: authenticated InfoSparks chart tooltips, captured November 5.
Freddie Mac weekly context
On November 5, Freddie Mac's weekly 30-year fixed survey was 7.18%. It uses a different survey method from Mortgage News Daily and should be read separately. Confirm the rate, points and total costs for your own loan with your lender.
Freddie Mac weekly series through FRED | Mortgage News Daily's current rate index
Click Below to View Listings
79 Hewitt DR, Steilacoom was listed at $1,200,000 and verified Active on November 5, 2026. Its public page still shows Active at $1,200,000 when rechecked November 10. MLS #2600554 matches the dated detached-home search. This is a verified Active example, not a representative city price; its public status alone does not establish a new-listing date. Availability and pricing can change.
Let's talk through your Steilacoom move
See the complete weekly activity table
Activity | Oct 22-28 | Oct 29-Nov 4 | Change | Change % |
|---|---|---|---|---|
First Look | 0 | 0 | 0 | 0.0% |
New Active activity | 4 | 1 | -3 | -75.0% |
Back on Market | 1 | 0 | -1 | -100.0% |
Price Reduced | 0 | 2 | +2 | N/A (new activity) |
Price Increased | 0 | 0 | 0 | 0.0% |
Contingent | 0 | 0 | 0 | 0.0% |
Expired | 0 | 0 | 0 | 0.0% |
Pending | 2 | 2 | 0 | 0.0% |
Sold | 1 | 1 | 0 | 0.0% |
Canceled | 1 | 0 | -1 | -100.0% |
In Steilacoom’s smaller market, I’d start with the homes that most closely match yours, or the ones you’re considering buying. Let’s compare their condition, location and pricing before deciding what this week’s activity means for your move. Reach me at 206-349-9748 or [email protected].
Jeremy Minor
Team NSRG