

There is a little more movement in Mountlake Terrace this week, but it is still a small enough market that a few homes can change the picture. Buyer commitments picked up in the latest report while price reductions held steady. I would keep the focus on how a home compares with the other choices in its price range.
For buyers: If a home fits your daily routine, look closely at its condition, ownership costs and nearby alternatives. The quieter-looking citywide numbers do not tell you whether another buyer is considering that same home.
For sellers: Make the comparison easy for buyers. A clear asking price, thoughtful preparation and a quick response to showing feedback can matter more than trying to time a citywide shift.
This Week's Listing Activity
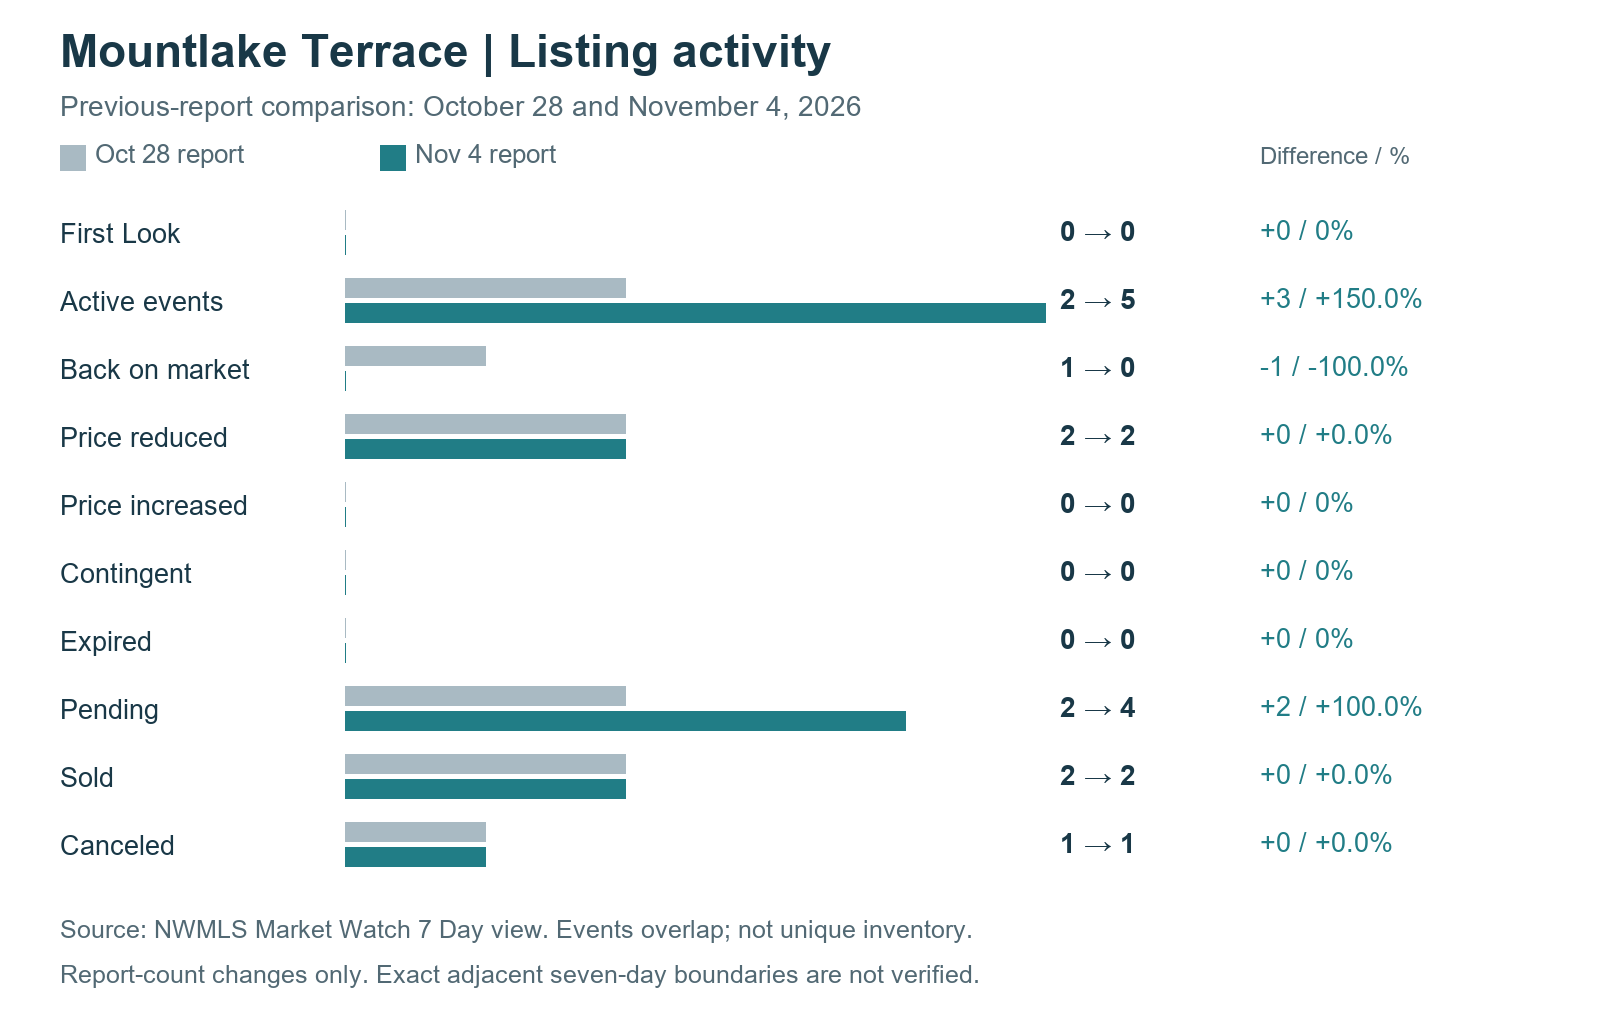
These are changes in reported listing events, not counts of all available homes. The comparison is between saved reports; exact adjacent seven-day windows are not established.
October Prices In Context
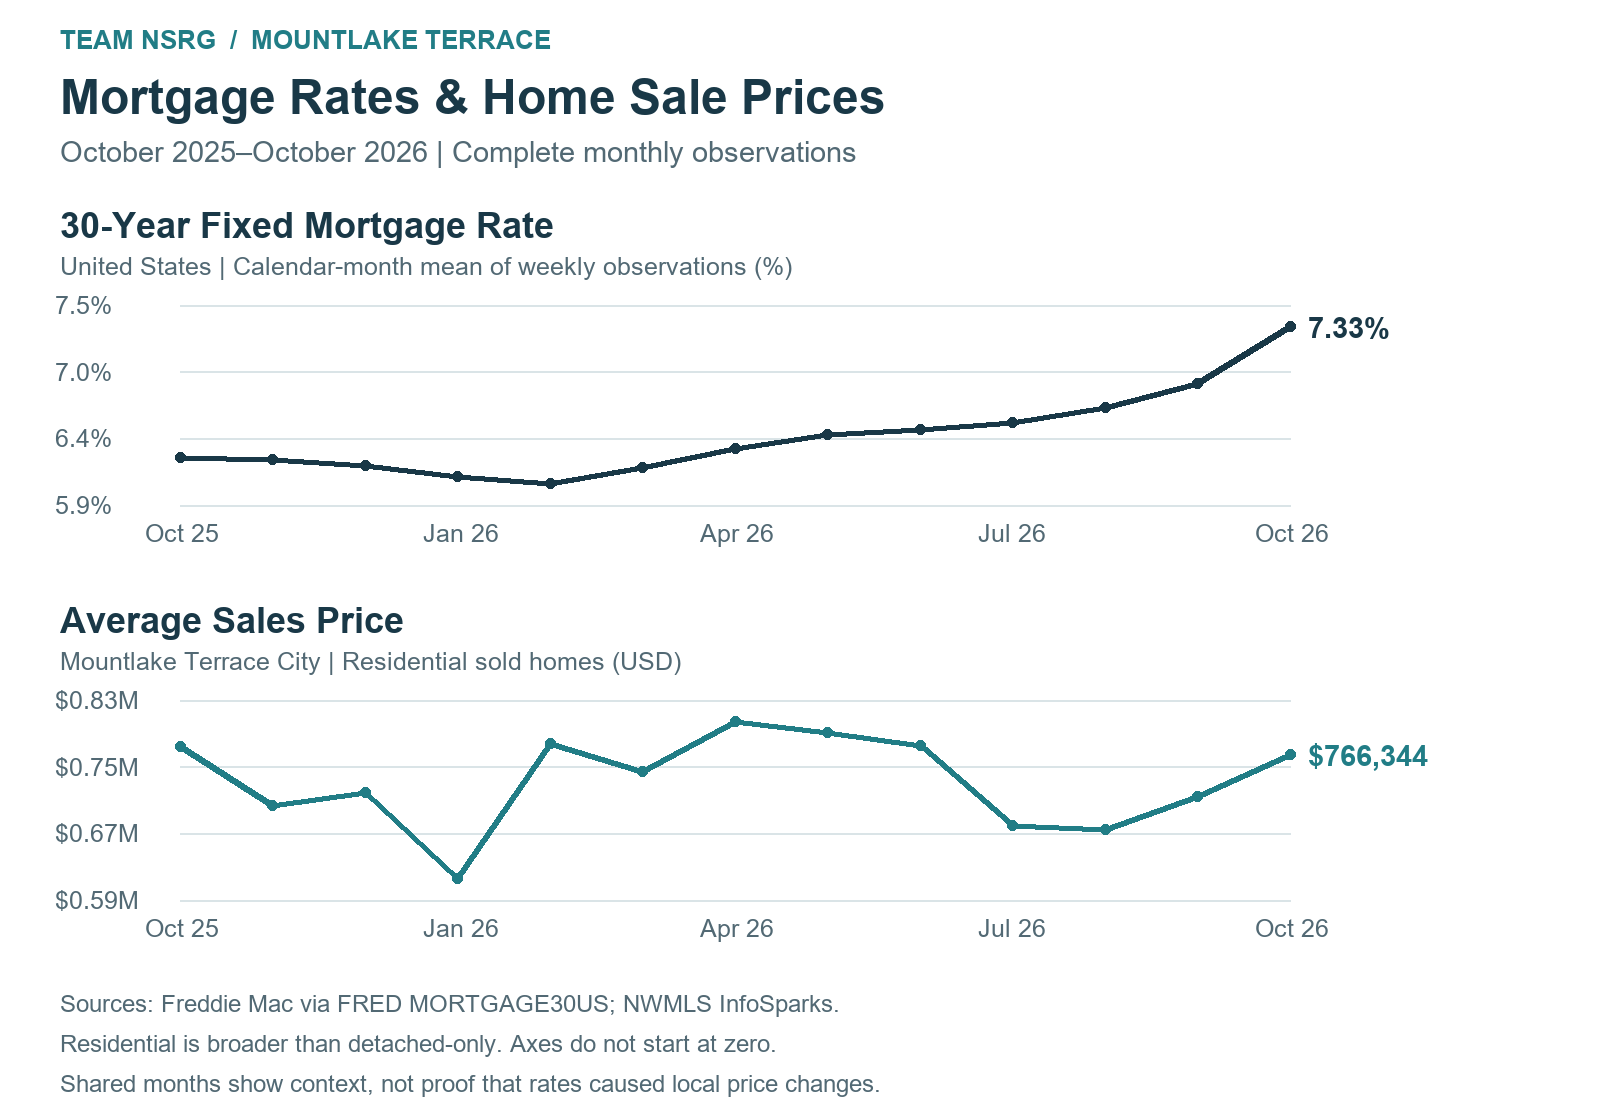
October's average sale price recovered from September and finished close to last October. That is useful context for a conversation about value, but the mix of homes that closed still matters. I would start with sales that share your home's size, condition and location.
October average sale price | Change |
|---|---|
2026: $766,344 | Month over month: +7.1% |
2025: $775,942 | Year over year: -1.2% |
The broader Residential monthly series and detached-only weekly query describe different groups of homes. The aligned chart keeps borrowing costs beside local sold prices without treating their movement as proof of cause.
Current Mortgage Rate Context
November 4, 2026 snapshot: Mortgage News Daily's 30-year fixed index was 7.22%, down 0.08 percentage points from its previous reading. Keep your payment budget current with your lender as you compare homes. This daily index is separate from the monthly Freddie Mac averages above.
Loan product | Rate / daily movement |
|---|---|
30-year fixed | 7.22% / -0.08 pp |
15-year fixed | 6.85% / -0.06 pp |
30-year jumbo | 7.40% / -0.05 pp |
7/6 SOFR ARM | 6.73% / +0.02 pp |
30-year FHA | 6.89% / -0.06 pp |
30-year VA | 6.90% / -0.07 pp |
View live Mortgage News Daily rates · View daily rate movement
Click Below to View Listings
Here is one active home from the current listing-event snapshot to explore. It is an example, not the full available inventory.
View 22425 69th Place W on Team NSRG
MLS #2599115 · $1,040,000 · Active when checked November 4
Let's Talk About Your Next Move
For a Mountlake Terrace move, I would put the recent pickup in buyer commitments beside the specific homes on your shortlist. If you are weighing a sale or a purchase, I would be happy to talk through the options and help you compare the tradeoffs.
Jeremy Minor | Team NSRG
[email protected] · 206-349-9748
The Data Behind The Charts
Weekly report counts and changes
Event | October 28 → November 4; change |
|---|---|
First Look | 0 → 0; +0; 0% |
Active events | 2 → 5; +3; 150.0% |
Back on market | 1 → 0; -1; -100.0% |
Price reduced | 2 → 2; +0; 0.0% |
Price increased | 0 → 0; +0; 0% |
Contingent | 0 → 0; +0; 0% |
Expired | 0 → 0; +0; 0% |
Pending | 2 → 4; +2; 100.0% |
Sold | 2 → 2; +0; 0.0% |
Canceled | 1 → 1; +0; 0.0% |
Percentages compare report counts. Both-zero is shown as 0%; a zero baseline with new activity has no defined percentage change.
Monthly average sales prices
Month | Residential average sale price |
|---|---|
October 2025 | $775,942 |
November 2025 | $705,121 |
December 2025 | $721,079 |
January 2026 | $617,000 |
February 2026 | $780,000 |
March 2026 | $746,192 |
April 2026 | $805,944 |
May 2026 | $793,600 |
June 2026 | $777,831 |
July 2026 | $680,066 |
August 2026 | $676,250 |
September 2026 | $715,510 |
October 2026 | $766,344 |
Monthly national mortgage rates
Month | 30-year fixed monthly mean |
|---|---|
October 2025 | 6.2540% |
November 2025 | 6.2375% |
December 2025 | 6.1900% |
January 2026 | 6.1025% |
February 2026 | 6.0475% |
March 2026 | 6.1775% |
April 2026 | 6.3320% |
May 2026 | 6.4425% |
June 2026 | 6.4900% |
July 2026 | 6.5420% |
August 2026 | 6.6675% |
September 2026 | 6.8625% |
October 2026 | 7.3280% |
Sources And Scope
NWMLS Matrix Market Watch, 7 Day view, captured November 4, 2026 at 8:21:51 a.m. PST (16:21:51.504 UTC). Washington, Snohomish County, MLS City Mountlake Terrace, Single Family/Residential, styles 10–18, 25 and 26; Attached/Zero Lot Line and Incomplete excluded. No price, ZIP, map, broker or office restriction. Active and First Look queries show October 28 onward; upper clock cutoff and source timezone are not exposed. Other event boundaries were not individually checked. MLS City does not independently establish municipal boundaries.
Previous report: October 28 at 16:14:44.237 UTC, October 21 onward Active boundary, no verified upper cutoff. Same detached query scope; previous-report comparisons are not established adjacent 168-hour changes. Status events overlap and cannot be summed as unique inventory.
NWMLS InfoSparks: Mountlake Terrace City, Residential, all construction types and other property filters unrestricted, Monthly Average Sales Price. October 2025–October 2026 tooltips captured November 4. This broader Residential scope is not detached-only; averages reflect the mix of completed sales.
Freddie Mac via FRED MORTGAGE30US, United States, percent, not seasonally adjusted. Calendar-month arithmetic means of verified weekly observations, October 2025–October 2026. Source updated October 29, 2026. Chart axes do not start at zero.
Mortgage News Daily, November 4, 2026 daily index, retrieved November 4. Movement is in percentage points. National indexes are not personalized loan quotes or APRs. Listing identities, MLS numbers and displayed statuses checked November 4; availability can change. Artwork is an original city-inspired illustration, not a property photograph.