
TEAM NSRG · LOCAL MARKET UPDATE
By Jeremy Minor · November 10, 2026
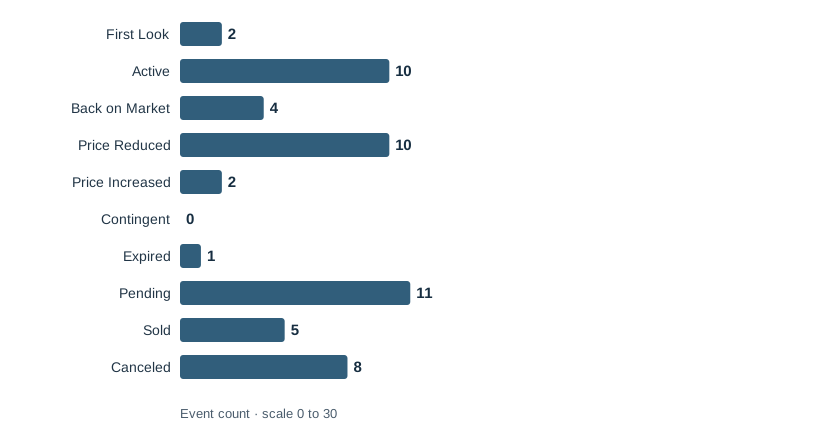
Lynnwood sellers are making price adjustments while buyers are still moving ahead. The latest seven-day view recorded 10 price reductions and 11 pending events. For buyers, that makes a close look at pricing worthwhile. For sellers, the useful question is how your home compares with the alternatives buyers can tour now.
What I would watch as a buyer
I would start with the homes that fit your payment and location, then compare their asking prices with similar closed sales. A price reduction is a reason to take another look, not proof that a property is a bargain. Condition, inspection findings and the seller’s timing still matter.
What this means for sellers
The 11 pending events show that buyers are making decisions. With 10 price reductions also recorded, I would pay attention to the homes competing with yours and what their prices and condition offer. A clear price and good presentation give buyers less to second-guess.
Seven-day listing activity
November 3 through the November 10, 2026 capture · Detached single-family filter
October prices in context
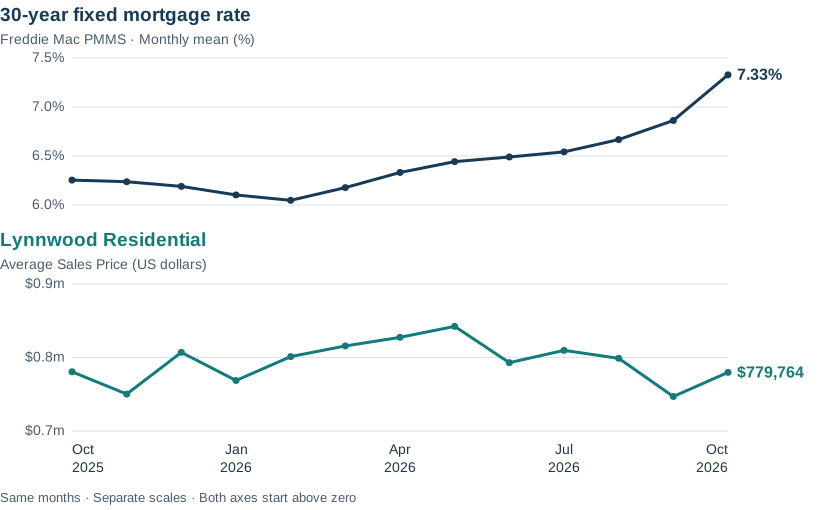
$779,764 Residential average sales price in October 2026
−0.1% year over year · +4.4% month over month
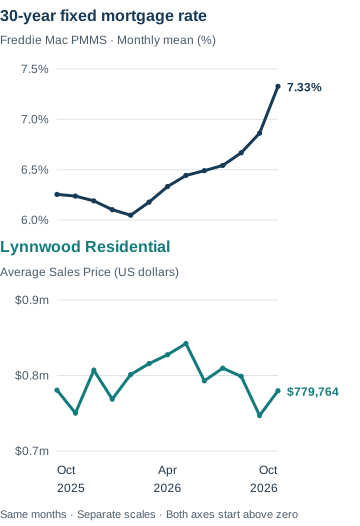
October’s broader Residential average was nearly unchanged from a year earlier and higher than September. Across the 13 months shown, the average moved both up and down rather than following a steady climb. I would use that as background and price a particular home from closer comparables.
Lynnwood monthly mortgage rates and Residential prices
Mortgage News Daily rate snapshot
On November 10, 2026, Mortgage News Daily’s daily 30-year fixed index was 7.30%, up 0.12 percentage point from its previous daily reading. This daily index is separate from the monthly Freddie Mac averages in the chart.
View today’s mortgage rates
Follow the MND daily rate index
Separately, Freddie Mac’s national weekly 30-year fixed average was 7.18% as of November 5, 2026. Your quote depends on the loan and borrower details, so I would confirm your payment with your lender before making an offer.
Click Below to View Listings
First Look Listings*
20721 55th Avenue W · MLS 26021543618 176th Place SW · MLS 2600757
Selected New Active Listings
5117 188th Street SW · MLS 26016713513 176th Place SW · MLS 25971423909 178th Street SW · MLS 2600077
A practical next step in Lynnwood
In Lynnwood, there is both movement and price adjustment to work through. If you are weighing a purchase or a sale, I am happy to help compare the homes that matter for your neighborhood and price range.
Talk with Jeremy about your next move
Jeremy Minor
Team NSRG
Data details
Exact values behind the charts. Weekly counts are overlapping listing-status events; monthly prices cover broader Residential sales.
Event category | Events |
|---|---|
First Look | 2 |
Active | 10 |
Back on Market | 4 |
Price Reduced | 10 |
Price Increased | 2 |
Contingent | 0 |
Expired | 1 |
Pending | 11 |
Sold | 5 |
Canceled | 8 |
Month | Average rate |
|---|---|
October 2025 | 6.25% |
November 2025 | 6.24% |
December 2025 | 6.19% |
January 2026 | 6.10% |
February 2026 | 6.05% |
March 2026 | 6.18% |
April 2026 | 6.33% |
May 2026 | 6.44% |
June 2026 | 6.49% |
July 2026 | 6.54% |
August 2026 | 6.67% |
September 2026 | 6.86% |
October 2026 | 7.33% |
Month | Average sales price |
|---|---|
October 2025 | $780,573 |
November 2025 | $750,217 |
December 2025 | $806,965 |
January 2026 | $768,703 |
February 2026 | $801,212 |
March 2026 | $815,747 |
April 2026 | $827,471 |
May 2026 | $842,340 |
June 2026 | $792,952 |
July 2026 | $809,695 |
August 2026 | $798,865 |
September 2026 | $746,928 |
October 2026 | $779,764 |
Month | Average sales price |
|---|---|
October 2024 | $872,036 |
October 2025 | $780,573 |
October 2026 | $779,764 |
Sources and scope
Weekly: Authenticated NWMLS Matrix Market Watch, “7 Day,” captured November 10, 2026 at 10:41:36 a.m. PST (UTC−08:00; 18:41:36 UTC). The displayed date criterion starts on November 3, 2026 and runs through capture. The exact starting time was not exposed; this is not an audited 168-hour window.
Filters: Single Family widget; Residential subtype; Washington; Snohomish County; exact MLS City “Lynnwood”; styles 10–18, 25 and 26; Building Information excludes Attached/Zero Lot Line; status excludes Incomplete. No additional area, community, map, price or date restrictions. The MLS City field is not a verified municipal boundary. Categories are overlapping listing-status events, not unique homes, total inventory or a net change. “Active” counts activity during this source period, not all active listings. The previous published October 27 snapshot was checked, but its Incomplete exclusion could not be verified and the report periods are not adjacent. No matched-filter prior seven-day baseline is available, so no week-over-week change is shown.
Monthly: NWMLS InfoSparks, exact City “Lynnwood,” Residential, Average Sales Price, Monthly. All style codes, prices, bedrooms, lot sizes, construction, square footage, waterfront selections and transaction sides. October 2026 is the latest complete month. Read November 10, 2026 around 10:50–10:55 a.m. PST; final capture 10:55:19 a.m. PST (18:55:19 UTC). Values come from the rendered InfoSparks chart, not a successfully downloaded CSV. This broader Residential series is not detached-only. The average reflects the mix of closings, not same-home appreciation or an individual property valuation. YoY compares October 2026 with October 2025; MoM compares October 2026 with September 2026. The trend chart’s dollar axis does not begin at zero.
Monthly rates: Arithmetic monthly means of the retained weekly national 30-year fixed Freddie Mac PMMS archive observations, October 2025 through October 2026. The official 2025 and 2026 archives were rechecked November 10, 2026 around 4 p.m. PST (November 11 around 00:00 UTC); all 57 displayed weekly observations were independently aggregated and matched the 13 monthly means. The source is the official rendered archive, not a downloaded historical spreadsheet. Values displayed here are rounded to two decimals; the underlying means are retained in the source file. This is an aggregation of weekly Freddie Mac observations, not a native FRED monthly export. FRED MORTGAGE30US identifies the corresponding weekly series. Both chart panels use the same months with separate vertical scales; neither axis starts at zero. The comparison does not establish a causal relationship between rates and local prices.
Dated rate context: Freddie Mac PMMS, November 5, 2026; Mortgage News Daily daily index, November 10, 2026, with the historical daily reading reverified on November 10. Different methods and periods; these are national reference figures, not personal loan quotes.
Listing links: Linked Team NSRG pages match two First Look and three of the ten Active records. Their IDX source time was November 10, 2026 at 8:45 a.m. PST (16:45 UTC), earlier than this NWMLS capture. Other matching public destinations were not verified. Availability can change.
Artwork: Reused undated Team NSRG city-inspired editorial illustrations, not photographs or verified exact city views.