Team NSRG | October 27, 2026 | By Jeremy Minor
Historical report snapshot: October 27, 2026. Market figures below reflect that report date; listing-status notes were checked November 3, 2026. This is not a current-week market update.
Lynnwood buyers have more room to compare, while sellers need to make a clear case for their asking price. September's broader Residential market had substantially more homes for sale than a year earlier and a lower average sold-home price. My read is that preparation and realistic pricing matter more than relying on yesterday's market.
What Buyers And Sellers Can Take From This
For buyers: Compare the alternatives carefully and keep condition, location and your monthly payment in view. More selection can create negotiating opportunities, but it does not make every asking price a bargain.
For sellers: Show buyers why your home is worth choosing. A competitive price and strong presentation can help you stand out when buyers have more alternatives.
The October 27 Report Snapshot
The October 27 snapshot recorded 10 pending events, 7 sold events and 13 price reductions. Our October 20 report recorded 14, 11 and 18 respectively. Activity was quieter across those categories. These are comparisons with our October 20 report, not identical seven-day periods.
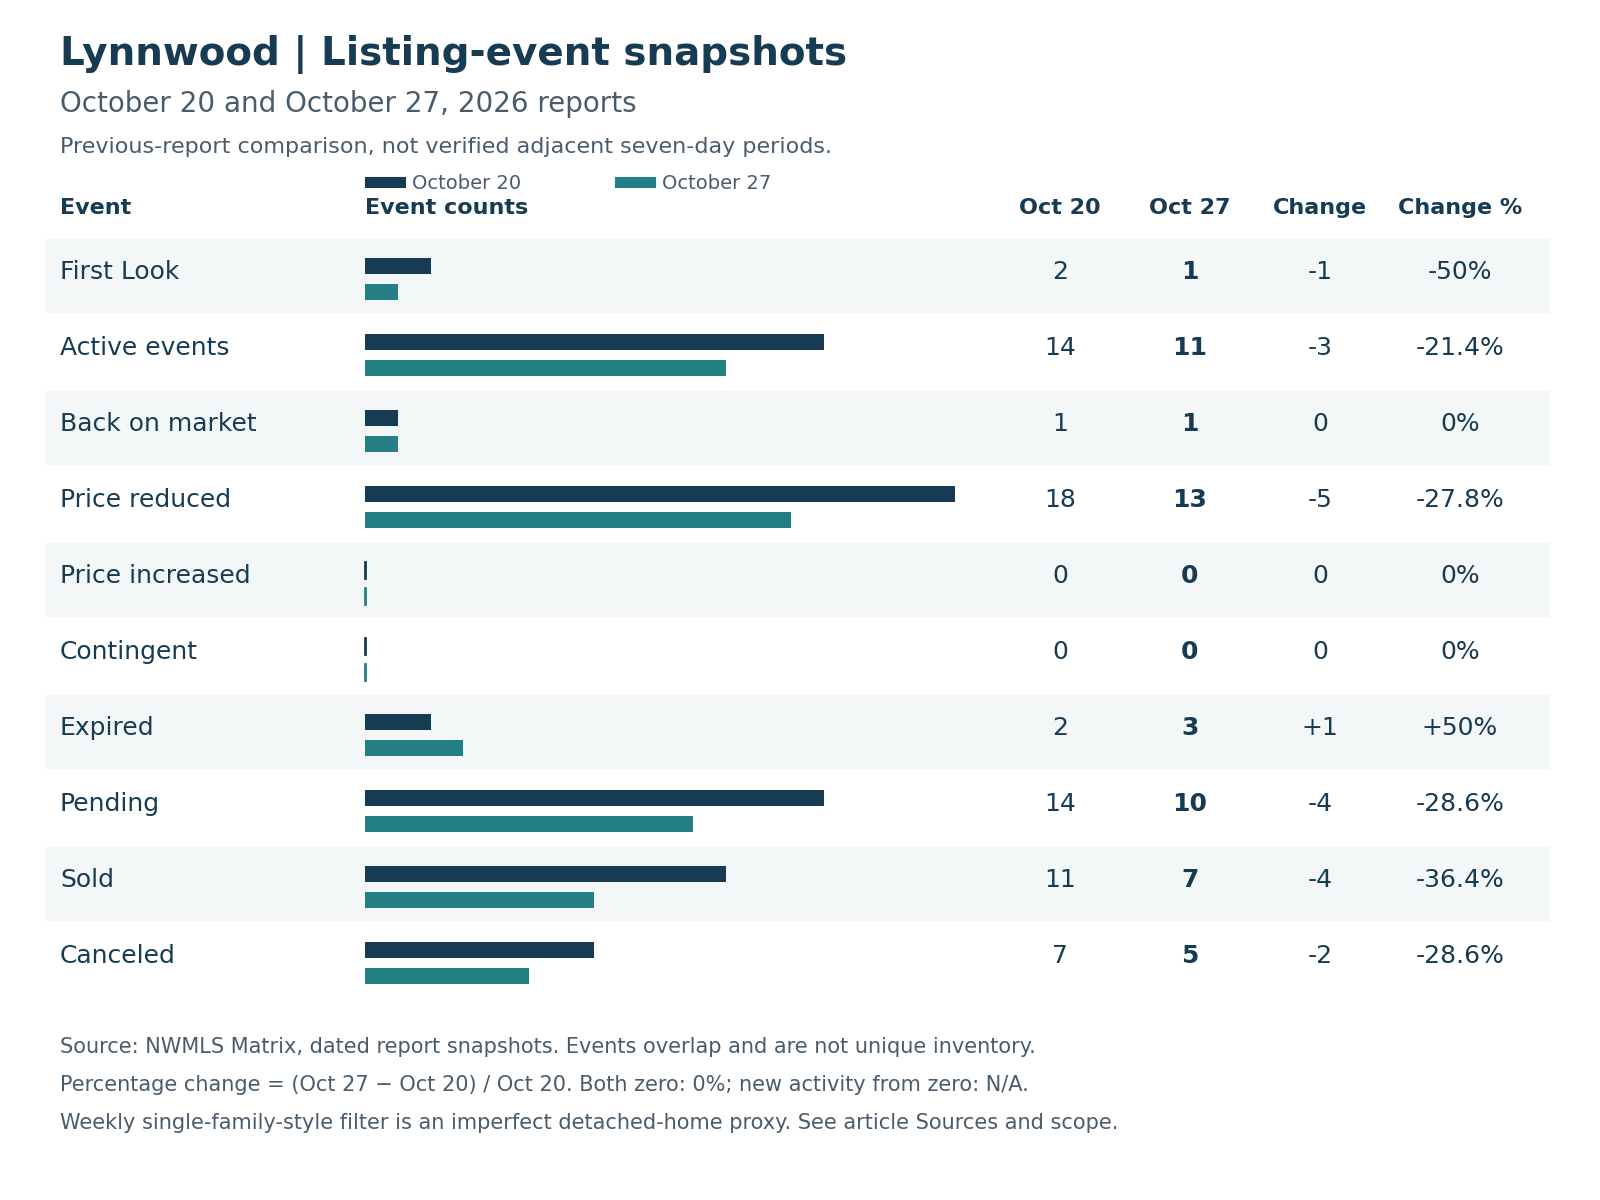
Open full-size Lynnwood saved report snapshots, October 20 and October 27
Open the large-text mobile chart
September Context For Your Decision
September's broader Residential homes for sale rose 50.3% year over year, while closed sales fell 5.1%. Average sold-home price was 3.5% lower than a year earlier and 6.5% below August. Together, these figures suggest buyers can be selective and sellers should test their asking price against the actual competition.
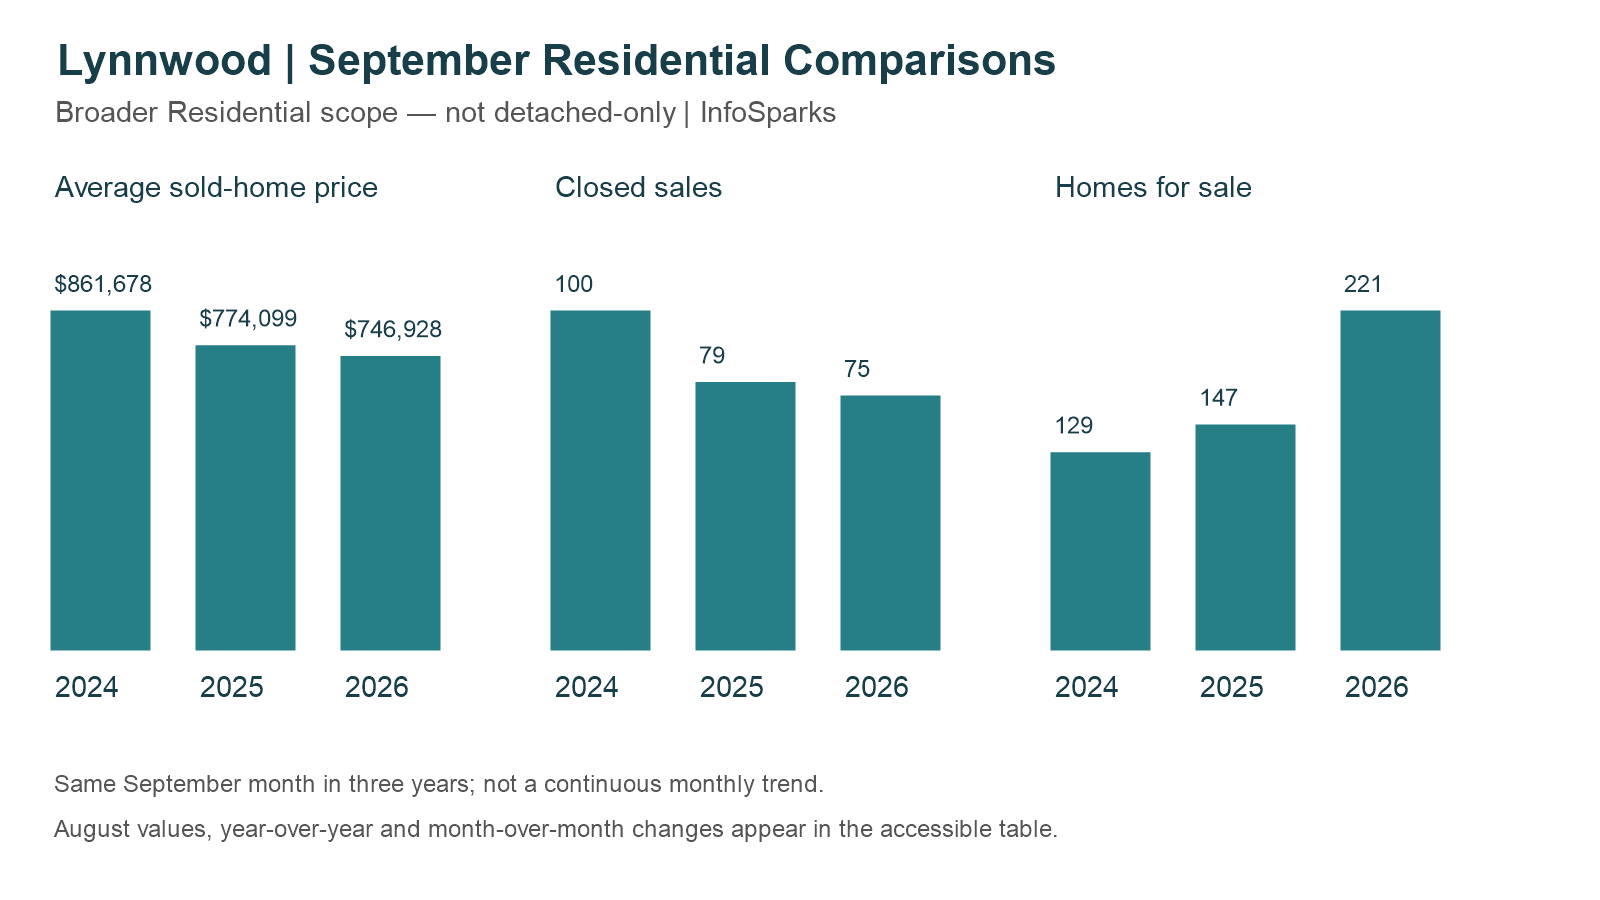
Open full-size Lynnwood September Residential comparison, 2024 to 2026
The Monthly Price Path
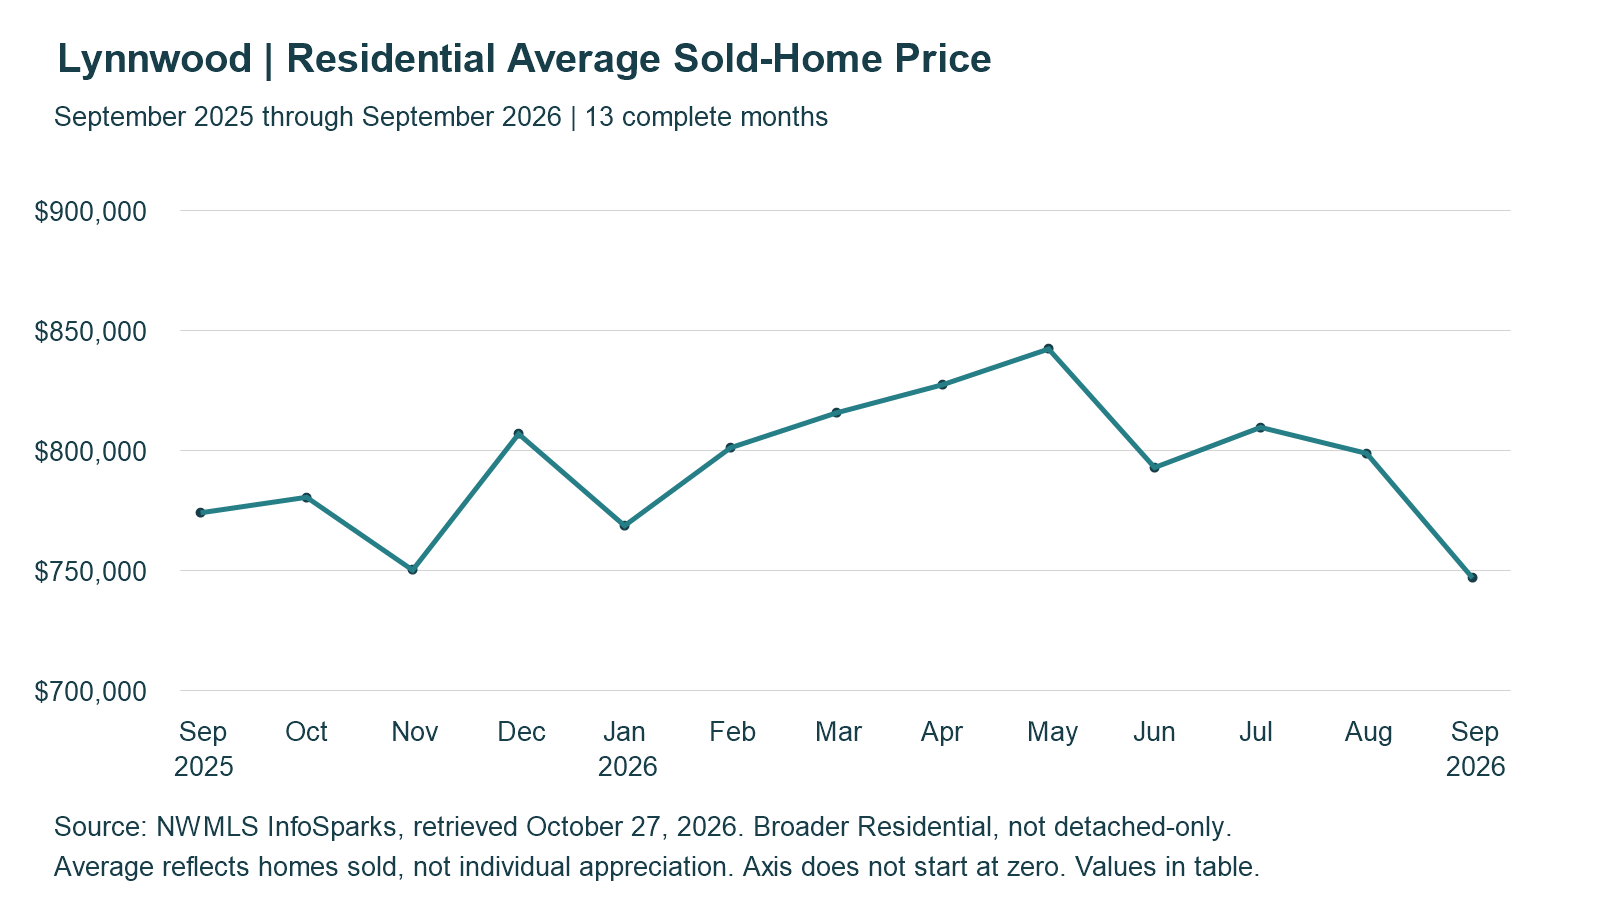
Open full-size Lynnwood monthly Residential average sold price, September 2025 to September 2026
Rates And Your Monthly Payment
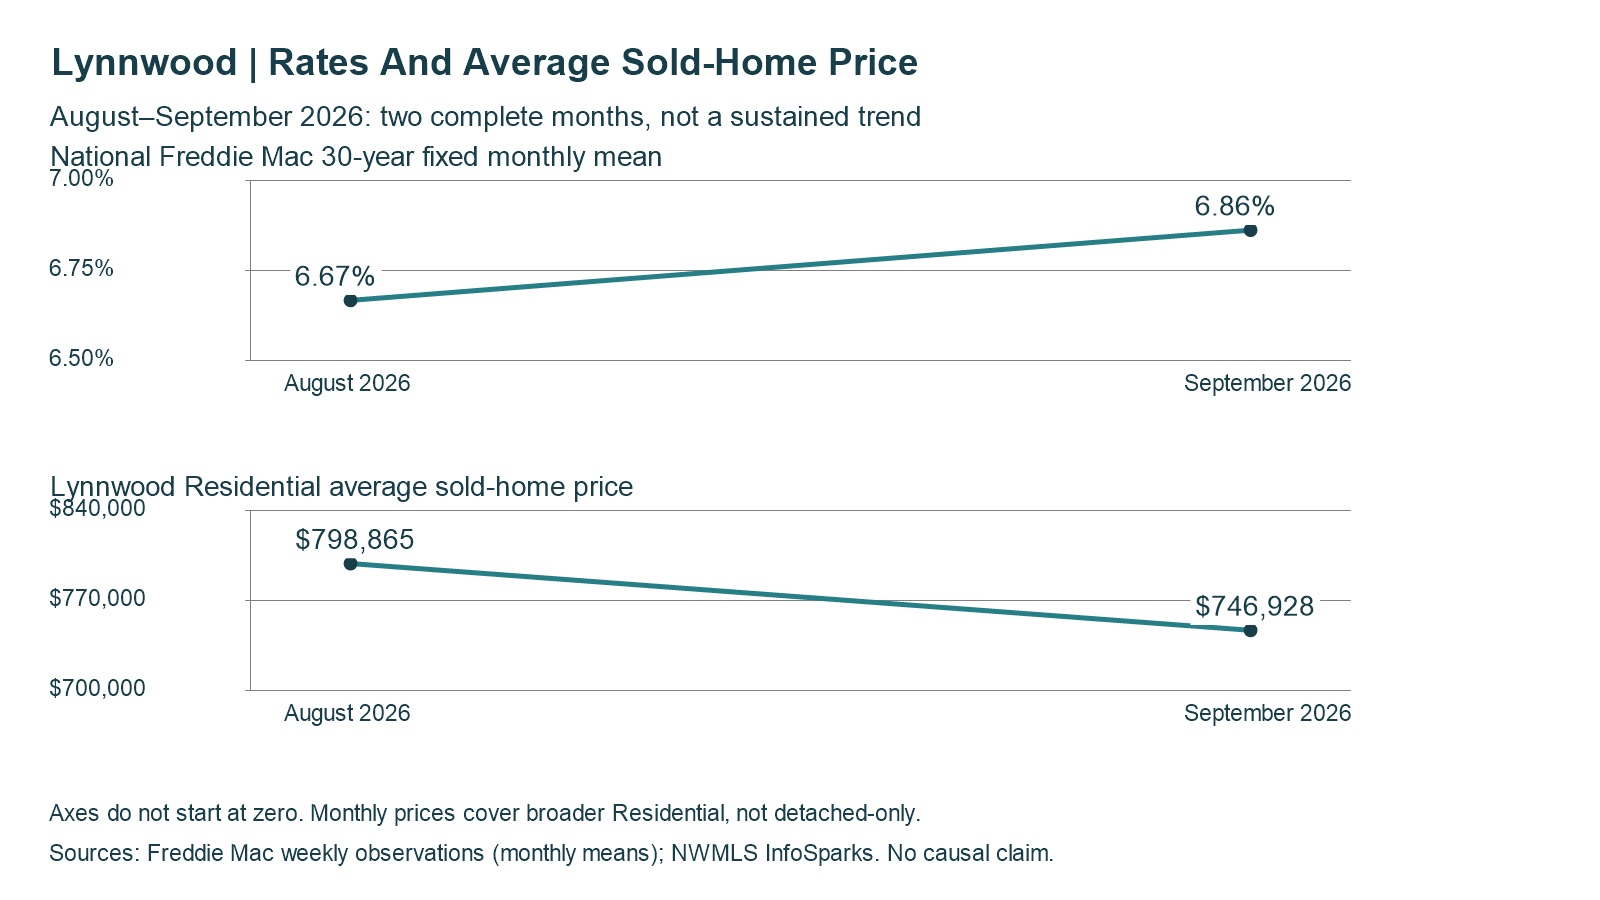
August and September 2026 only: a two-month comparison, not a sustained trend.
The national 30-year fixed weekly survey averaged 6.67% in August and 6.86% in September. Price is only one part of affordability: compare the payment for the home and financing available to you. These national series do not establish why local prices changed.
Mortgage-Rate Snapshot: October 26, 2026
The latest dated Mortgage News Daily observation checked for this report was October 26. These national index readings are context, not a lender quote or live widget. MND's daily index differs from Freddie Mac's weekly survey; the two methods and their rates are not interchangeable.
Loan type | Rate | Daily change (percentage points) |
|---|---|---|
30-year fixed | 7.33% | 0.00 |
15-year fixed | 6.99% | +0.01 |
30-year jumbo | 7.60% | 0.00 |
7/6 SOFR ARM | 6.82% | +0.07 |
30-year FHA | 6.96% | -0.02 |
30-year VA | 6.98% | -0.01 |
Current MND rate page | Daily rate movement and methodology
Questions Buyers And Sellers Ask
Does the average price tell me what my home is worth?
No. It describes the mix of homes that sold. Recent comparable sales, current competition, condition and location provide a more useful starting point for an individual home.
Do these weekly counts equal the number of homes available?
No. They count listing-status events in the source view, and a listing can appear in more than one category. Monthly homes-for-sale figures are a separate, broader Residential measure.
Click Below to View Listings
Active-Event Listings
Below are 9 working links from the 11 Active events in the October 27 report. They are not today's complete inventory; availability and status can change.
20411 56th Ave W - MLS 2597580
714 142nd St SW - MLS 2597625Pending as of November 3, 2026.
19330 52nd Ave W - MLS 2597281
5722 Hillpointe Cir - MLS 2596840Pending as of November 3, 2026.
20731 54th Ave W - MLS 2595273
6510 193rd St SW - MLS 2595802
14616 Ash Wy - MLS 2596249 (unincorporated Snohomish County)
First Look Listings
This link matches the First Look event in the October 27 report. First Look is the source status at that time; see the dated status notes below.
3513 176th Place SW - MLS 2597142Redfin: First look as of November 3, 2026.
Making Your Next Move
Lynnwood offers an opportunity to make a thoughtful move. Buyers can compare their options; sellers can compete through price and preparation. If you are considering a move, I am happy to help you put the relevant homes and numbers in context. - Jeremy
Contact Jeremy | Email | Call | Book a conversation
The Numbers Behind The Update
Listing event | October 20 report | October 27 report | Change | Change % |
|---|---|---|---|---|
First Look | 2 | 1 | -1 | -50% |
Active events | 14 | 11 | -3 | -21.4% |
Back on market | 1 | 1 | 0 | 0% |
Price reduced | 18 | 13 | -5 | -27.8% |
Price increased | 0 | 0 | 0 | 0% |
Contingent | 0 | 0 | 0 | 0% |
Expired | 2 | 3 | +1 | +50% |
Pending | 14 | 10 | -4 | -28.6% |
Sold | 11 | 7 | -4 | -36.4% |
Canceled | 7 | 5 | -2 | -28.6% |
Period | Average sold-home price |
|---|---|
September 2024 | $861,678 |
September 2025 | $774,099 |
August 2026 | $798,865 |
September 2026 | $746,928 |
Year over year | -3.5% |
Month over month | -6.5% |
Period | Closed sales |
|---|---|
September 2024 | 100 |
September 2025 | 79 |
August 2026 | 58 |
September 2026 | 75 |
Year over year | -5.1% |
Month over month | +29.3% |
Period | Homes for sale |
|---|---|
September 2024 | 129 |
September 2025 | 147 |
August 2026 | 202 |
September 2026 | 221 |
Year over year | +50.3% |
Month over month | +9.4% |
Month | National 30-year fixed mean |
|---|---|
August 2026 | 6.6675% |
September 2026 | 6.8625% |
Month | Residential average sold-home price |
|---|---|
August 2026 | $798,865 |
September 2026 | $746,928 |
Month | Average sold-home price |
|---|---|
September 2025 | $774,099 |
October 2025 | $780,573 |
November 2025 | $750,217 |
December 2025 | $806,965 |
January 2026 | $768,703 |
February 2026 | $801,212 |
March 2026 | $815,747 |
April 2026 | $827,471 |
May 2026 | $842,340 |
June 2026 | $792,952 |
July 2026 | $809,695 |
August 2026 | $798,865 |
September 2026 | $746,928 |