

Redmond buyers have fresh options to compare, while sellers continue to adjust pricing. The seven-day snapshot records 16 Active events, 23 price reductions, 5 pending events and 13 sales. These are activity counts, not a count of unique homes currently for sale.
This Week in Redmond
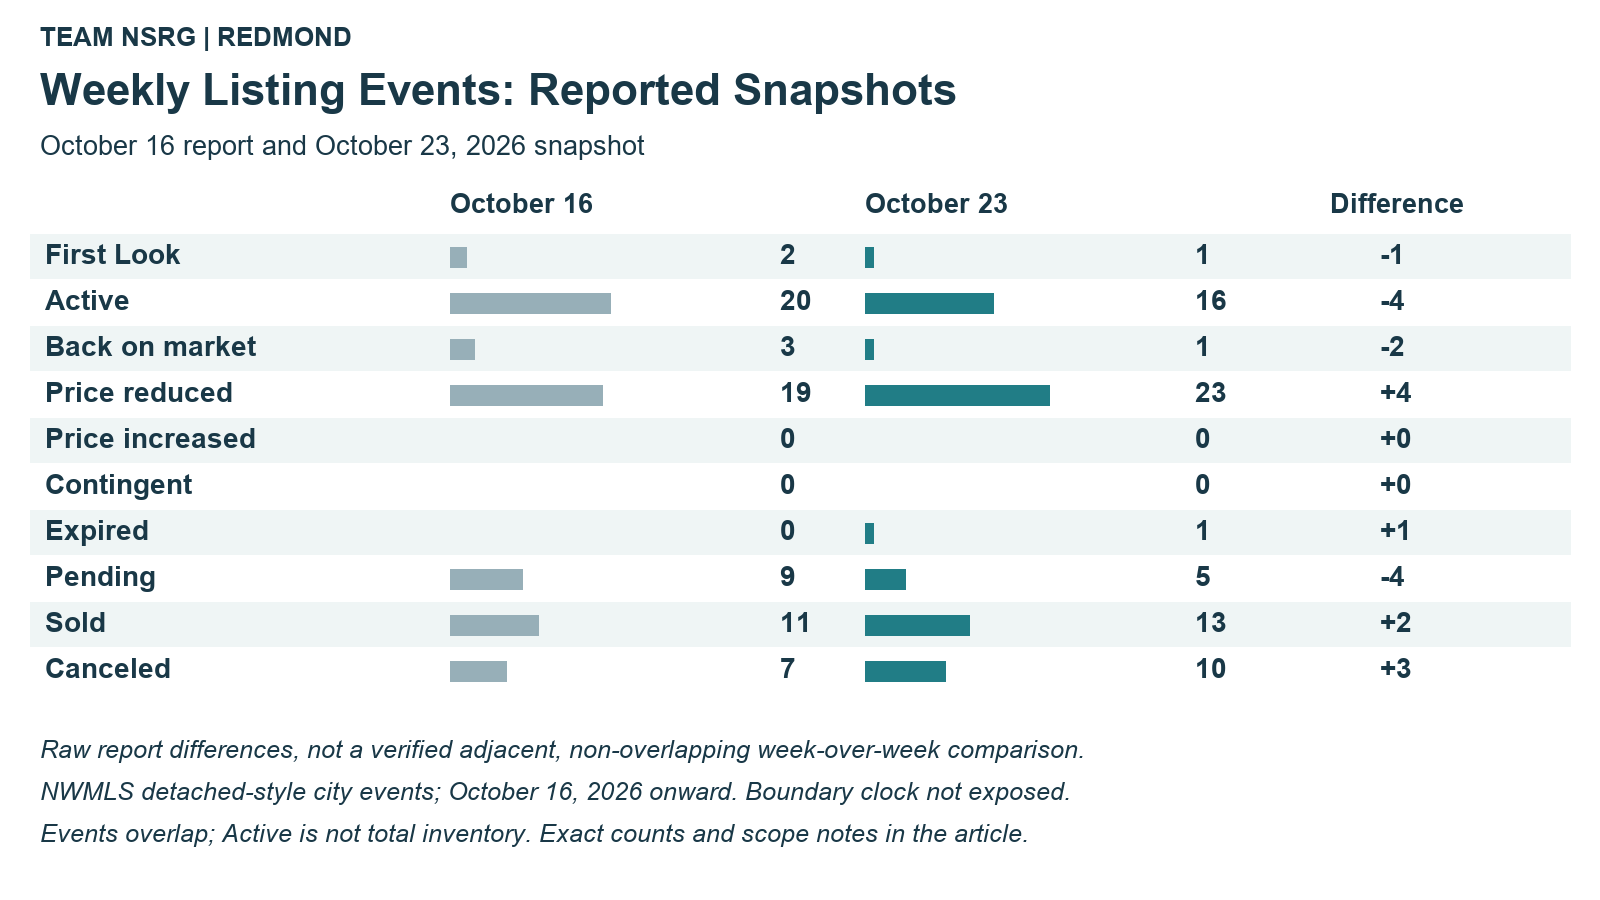
Event | October 16 report | October 23 snapshot | Raw difference |
|---|---|---|---|
First Look | 2 | 1 | -1 |
Active | 20 | 16 | -4 |
Back on market | 3 | 1 | -2 |
Price reduced | 19 | 23 | +4 |
Price increased | 0 | 0 | +0 |
Contingent | 0 | 0 | +0 |
Expired | 0 | 1 | +1 |
Pending | 9 | 5 | -4 |
Sold | 11 | 13 | +2 |
Canceled | 7 | 10 | +3 |
NWMLS Market Watch collected October 23, 2026 at 8:51 a.m. PDT. City: Redmond; detached-style Residential selection, excluding attached/zero-lot-line and Incomplete records. Displayed boundary October 16, 2026 onward; exact clock unavailable. Prior October 16 report uses October 9 onward. Identical boundary-clock and non-overlap have not been verified; differences above are reported-snapshot differences, not a measured week-over-week trend. Events can overlap. No weekly percentage change is calculated.
Price reductions can make a second look worthwhile for buyers, but condition, location and comparable sales still matter. For sellers, the pending and sold activity shows that buyers are making decisions; positioning your home against the alternatives is more useful than relying on a citywide average.
Explore the Listings Behind the Snapshot
View the 16 Active-event listings | View the First Look listing
Public selections verified against this snapshot. Status and availability may change after collection; these are selected event records, not all current city inventory.
September Redmond Market Context
The September 2026 average sold price was $1,574,923, -2.5% from September 2025 and -9.8% from August 2026. There were 65 closed sales and 238 homes for sale. Sold homes averaged 35 days on market; closed-sales months of supply was 4.8.
InfoSparks City of Redmond, Residential, all property styles: broader than the detached weekly selection. Average sold price is not median. Average days on market describes sold homes only. September 2026 is the latest complete month; incomplete October data is excluded.
Monthly Mortgage Rates and Average Sold Prices
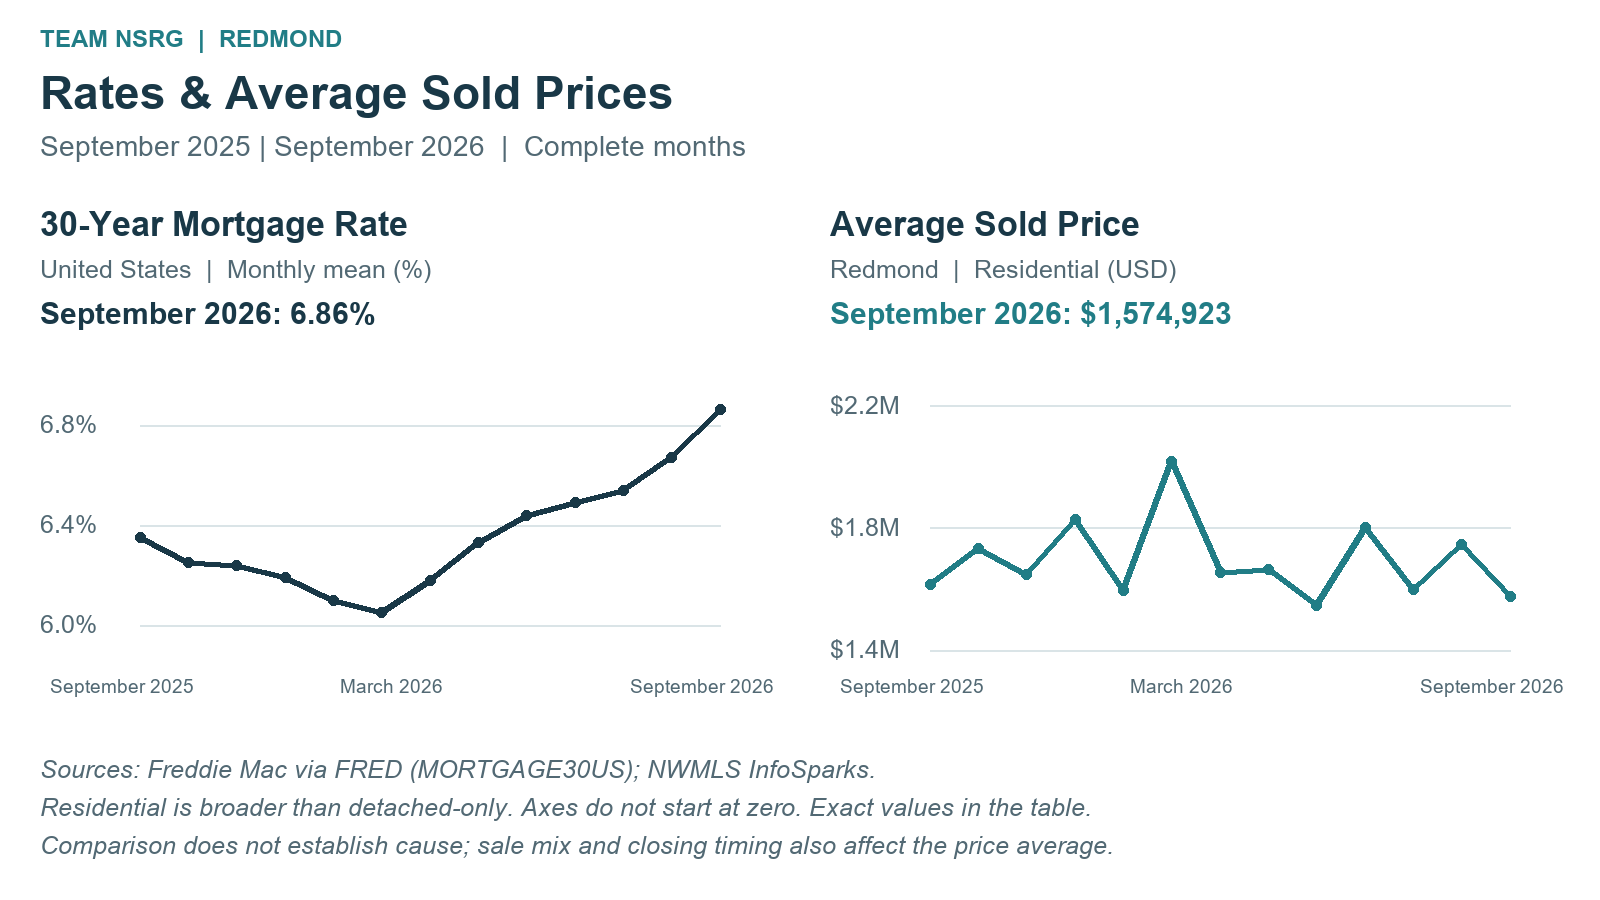
September 2025 through September 2026. Freddie Mac 30-year fixed rates via FRED are monthly means of weekly observations. Axes do not start at zero. Sale mix and closing timing affect average prices; this comparison does not establish causation.
Current Mortgage Rate Environment
The latest MND reading available when checked October 23, 2026 was dated October 22: the 30-year fixed index was 7.30%, down 0.10 percentage points from the prior reading. This daily index is separate from the monthly Freddie Mac series above. A current lender quote can help you understand your own financing options.
Loan product | Rate | Daily change (percentage points) |
|---|---|---|
30-year fixed | 7.30% | -0.10 |
15-year fixed | 6.96% | -0.08 |
30-year jumbo | 7.60% | -0.05 |
7/6 SOFR ARM | 7.78% | +0.96 |
30-year FHA | 6.92% | -0.13 |
30-year VA | 6.94% | -0.12 |
Dated national indexes, not personalized loan quotes or a live feed. The large ARM move is as reported in MND current and historical tables. Live MND rates | Daily rate movement.
Monthly Figures and Comparisons
Average sold price
September 2025 | August 2026 | September 2026 |
|---|---|---|
$1,614,971 | $1,745,120 | $1,574,923 |
September 2026: year-over-year -2.5%; month-over-month -9.8%.
New listings
September 2025 | August 2026 | September 2026 |
|---|---|---|
82 | 101 | 139 |
September 2026: year-over-year +69.5%; month-over-month +37.6%.
Homes for sale
September 2025 | August 2026 | September 2026 |
|---|---|---|
142 | 205 | 238 |
September 2026: year-over-year +67.6%; month-over-month +16.1%.
Pending sales
September 2025 | August 2026 | September 2026 |
|---|---|---|
58 | 66 | 47 |
September 2026: year-over-year -19.0%; month-over-month -28.8%.
Closed sales
September 2025 | August 2026 | September 2026 |
|---|---|---|
60 | 49 | 65 |
September 2026: year-over-year +8.3%; month-over-month +32.7%.
Sold-home average days on market
September 2025 | August 2026 | September 2026 |
|---|---|---|
29 | 33 | 35 |
September 2026: year-over-year +20.7%; month-over-month +6.1%.
Months supply, closed sales
September 2025 | August 2026 | September 2026 |
|---|---|---|
2.4 | 4.1 | 4.8 |
September 2026: year-over-year +100.0%; month-over-month +17.1%.
Exact Complete-Month Trend Values
Month | 30-year fixed monthly mean | Average sold price |
|---|---|---|
September 2025 | 6.35% | $1,614,971 |
October 2025 | 6.25% | $1,730,950 |
November 2025 | 6.24% | $1,648,007 |
December 2025 | 6.19% | $1,828,449 |
January 2026 | 6.10% | $1,595,312 |
February 2026 | 6.05% | $2,017,491 |
March 2026 | 6.18% | $1,653,540 |
April 2026 | 6.33% | $1,664,899 |
May 2026 | 6.44% | $1,546,963 |
June 2026 | 6.49% | $1,801,638 |
July 2026 | 6.54% | $1,598,925 |
August 2026 | 6.67% | $1,745,120 |
September 2026 | 6.86% | $1,574,923 |
Frequently Asked Questions
Does the average show what my home is worth?
No. The mix of homes sold changes each month. Relevant comparable sales, condition, location and property details matter for an individual home.
Are the weekly and monthly figures directly comparable?
They cover different periods and property selections. Weekly events use detached criteria; monthly Residential figures include other home styles. Use the monthly figures as broader context.
Sources and Scope
NWMLS Matrix and InfoSparks observations collected October 23, 2026, Pacific time. Source snapshots and exact tooltip values retained. October 16 Redmond report supplies the prior reported snapshot, not a verified adjacent non-overlapping baseline. Freddie Mac via FRED MORTGAGE30US, complete-month series from the verified October 22 production package. MND reading October 22, checked October 23. Figures may be revised. Artwork is illustrative.
Let’s Talk About Your Redmond Options
Redmond has new listing activity, price adjustments and completed sales happening together. For buyers, that calls for careful comparison; for sellers, a realistic position against competing homes matters. If you’re considering buying or selling in Redmond, I’m happy to help you review relevant homes and recent sales, discuss your options and build a plan around your timing and goals. — Jeremy Minor, Team NSRG