In Redmond’s latest search for detached single-family homes, NWMLS recorded 26 new listing events, 24 price reductions and 6 pending events. If you’re planning a move, I’d use this snapshot to decide which homes deserve a closer look, with the search limits below in mind.
For this detached single-family homes update, the weekly search uses NWMLS Residential styles 10 through 18, 25 and 26 in Redmond City in King County, across all prices. Listings marked Attached/Zero Lot Line are excluded. Results depend on MLS coding; attachment status has not been independently verified for each home.
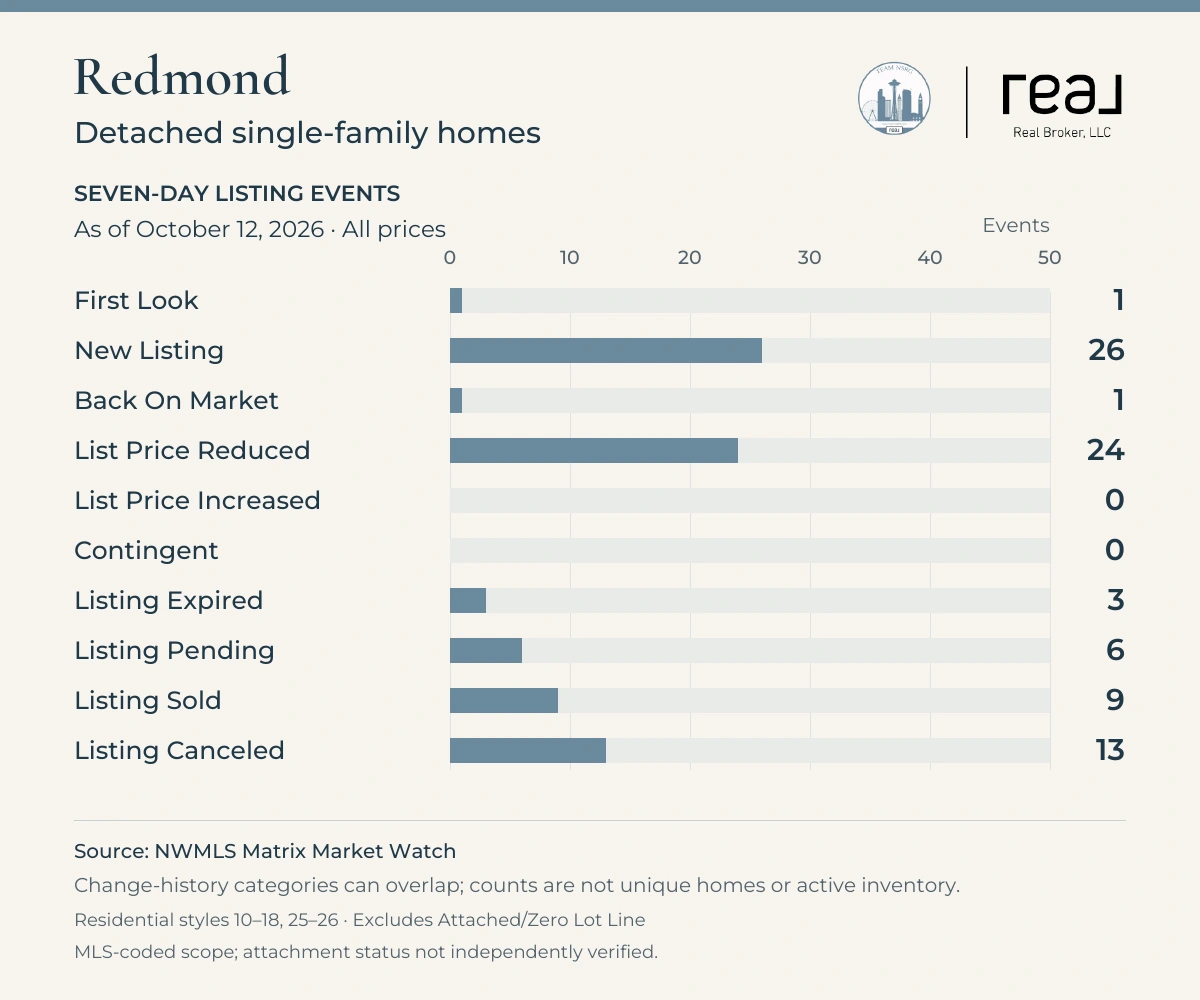
Seven day activity for Redmond detached single-family homes
NWMLS 7 Day view beginning October 5, 2026, through retrieval October 12, 2026.
View the mobile-friendly chart
Market Watch category | Events |
|---|---|
First Look | 1 |
New Listing | 26 |
Back On Market | 1 |
List Price Reduced | 24 |
List Price Increased | 0 |
Contingent | 0 |
Listing Expired | 3 |
Listing Pending | 6 |
Listing Sold | 9 |
Listing Canceled | 13 |
These are Market Watch change-history events. A property can appear in more than one category. The rows should not be added together as a count of unique properties or used to calculate inventory, absorption or a sold percentage. Pending and sold events may relate to listings that entered the market earlier.
For background on the separate First Look category, see Team NSRG’s First Look explainer.
September 2026 broader Residential context
InfoSparks reports a broader Residential category for its Redmond City area, including all styles and prices. It is not a detached-only series and does not reproduce the weekly property filter. The table shows September values, followed by a separate comparison with August.
September 2026 metric | Value |
|---|---|
Average days on market | 35 days |
Months of supply based on closed sales | 4.7 months |
Average sale price as a percent of original list price | 95.5% |
Closed sales | 65 |
Average sold price | $1,574,923 |
In this broader Residential category, average days on market was 35 in September, compared with 33 in August. Months of supply moved from 4.2 in August to 4.7 in September. There were 65 closed sales in September, compared with 49 in August.
The September average sold price was $1,574,923, compared with $1,745,120 in August. The average sale price as a percentage of original list price was 95.5%, compared with 94.8%. These averages reflect the homes that sold in each month. They do not measure the value change of an individual detached home or promise a discount on a current listing.
Reading Redmond detached single-family homes activity
The asking-price changes deserve attention alongside new listings and pending activity. Those categories can describe different homes, so they do not establish that the homes with price reductions were the ones that later went under contract.
A single seven-day view does not show all homes available or all homes already pending. I’d use it to refresh a search and identify listings worth investigating, then check the longer-term sales and the current competition for that specific home.
What buyers can take from this
For Redmond detached single-family homes, revisit listings whose prices have changed and compare them with fresh options that meet your needs. Check current availability and the full listing history before planning an offer. Base the decision on comparable homes and your budget rather than a citywide label.
What sellers can take from this
Review how your detached single-family home compares with the current choices in its price range. Condition, presentation and a price supported by relevant sales can make that comparison easier for buyers. Use feedback on your own property before assuming another home’s reduction calls for the same response.
Frequently asked questions
How much new listing and contract activity was recorded?
The filtered weekly search recorded 26 New Listing events and 6 Listing Pending events. These are separate change-history categories and can involve different or overlapping properties.
How many price reductions and sold events were recorded?
There were 24 List Price Reduced events and 9 Listing Sold events. Price reductions are changes to asking prices; sold events reflect completed closings and can relate to earlier contracts.
Are the monthly figures limited to Redmond detached single-family homes?
No. The separate InfoSparks monthly section is the broader Residential category, all styles and prices. It does not reproduce the selected-style proxy used for the weekly table.
How are detached single-family homes defined in this update?
The weekly search selects conventional Residential styles 10 through 18, 25 and 26 and excludes records marked Attached/Zero Lot Line. It relies on NWMLS coding rather than an independent check of each structure. The monthly Residential section includes all styles and is not detached-only.
If Redmond detached single-family homes are on your list, Team NSRG can help you work through the current choices and the comparable sales that matter.
[email protected] | 206-349-9748
Jeremy Minor | Team NSRG
Sources and scope
Source: Northwest Multiple Listing Service member Market Watch, 7 Day view, retrieved October 12, 2026 at 17:13:38 UTC. The query lower bound is October 5, 2026 and the snapshot includes activity through retrieval on October 12. This is not a completed October 5 through 11 calendar week. The query boundary time zone was not displayed. All prices are included; data may change as records are updated.
Search scope: NWMLS Residential subtype, style codes 10 through 18, 25 and 26, excluding listings marked Attached/Zero Lot Line in Building Information. Townhome, manufactured, condominium, floating-home and other unselected styles are outside the search. This is an MLS-coded approximation for detached single-family homes, not an independent physical inspection of attachment status. Geography uses the NWMLS City field.
Monthly source: NWMLS InfoSparks, September 2026 monthly view with August 2026 comparison, retrieved October 12, 2026. Residential, all styles and prices, InfoSparks City area. Average days on market measures listing to offer acceptance. Months of supply uses month-end inventory divided by average monthly closed sales over the preceding 12 months. Average percent of original list price uses the listing ID, excludes concessions and can reset after relisting. Closed-sales totals are not guaranteed to be the sample size for every other metric. Weekly and monthly property scopes differ.
Market Watch source: NWMLS member portal (member sign-in required). InfoSparks source (member access may be required). Data is deemed reliable but not guaranteed. Verify current listing information before acting.