
Historical report: November 13, 2026 listing-event snapshot, completed November 17, 2026. This is not current inventory. Monthly data vintages are identified below.
Redmond has fresh listing activity alongside price adjustments. The latest snapshot recorded 17 price reductions and 15 pending events. Buyers have reasons to compare carefully, while sellers benefit from positioning against the homes buyers can choose today.
For buyers, a reduced price is a reason to take another look, not a guarantee of value. For sellers, recent comparable sales, condition and competing listings remain more useful than a citywide average.

This week in Redmond
November 6, 2026 onward through the November 13 collection. These are listing-status events, not unique homes currently available.
Previous-report comparison
October 23 and November 13 snapshots are nonadjacent, not week-over-week change.
First Look
October 23: 1
November 13: 1
Active
October 23: 16
November 13: 9
Back on market
October 23: 1
November 13: 2
Price reduced
October 23: 23
November 13: 17
Price increased
October 23: 0
November 13: 1
Contingent
October 23: 0
November 13: 0
Expired
October 23: 1
November 13: 3
Pending
October 23: 5
November 13: 15
Sold
October 23: 13
November 13: 5
Canceled
October 23: 10
November 13: 9
October market context
The October 2026 Residential average sold price was $1,537,795. Monthly Residential data includes all property styles and is broader than the detached-home weekly selection. The mix of homes sold affects average prices; it does not establish an individual property value.
Monthly mortgage rates and average sold prices
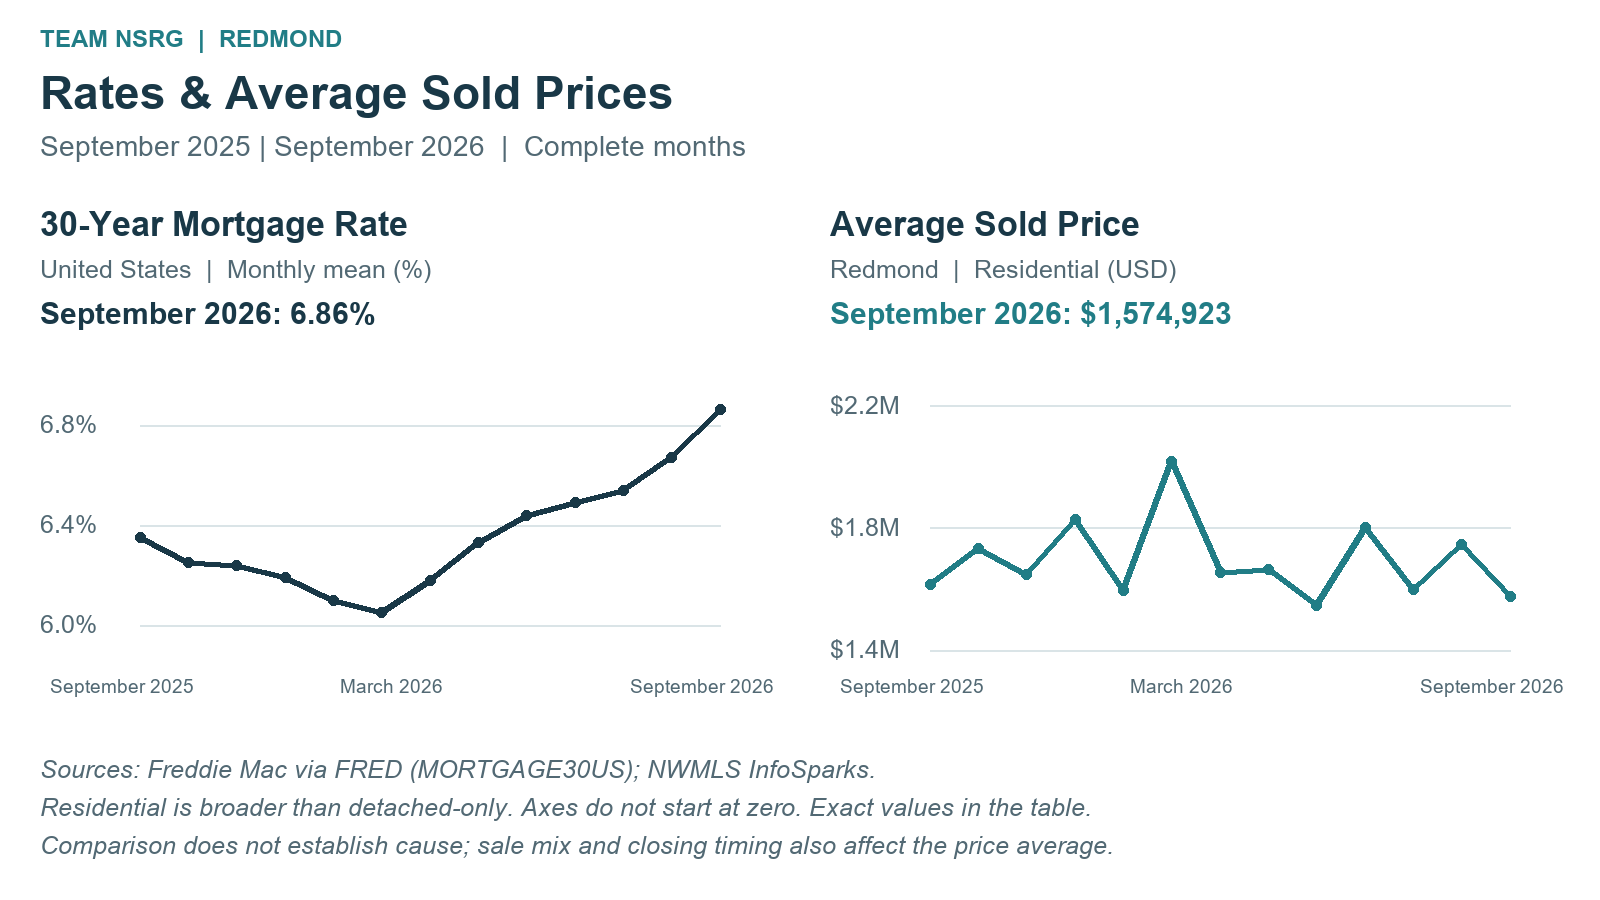
Chart vintage: September 2025 through September 2026, retained from the October 23 report. The chart does not include October 2026. Axes do not start at zero. The table below advances the window by one month and includes the separately verified October endpoint.
Month | Residential average sold price | 30-year fixed monthly mean |
|---|---|---|
October 2025 | $1,730,950 | 6.25% |
November 2025 | $1,648,007 | 6.24% |
December 2025 | $1,828,449 | 6.19% |
January 2026 | $1,595,312 | 6.10% |
February 2026 | $2,017,491 | 6.05% |
March 2026 | $1,653,540 | 6.18% |
April 2026 | $1,664,899 | 6.33% |
May 2026 | $1,546,963 | 6.44% |
June 2026 | $1,801,638 | 6.49% |
July 2026 | $1,598,925 | 6.54% |
August 2026 | $1,745,120 | 6.67% |
September 2026 | $1,574,923 | 6.86% |
October 2026 | $1,537,795 | 7.33% |
Prices through September 2026 retain the exact tooltip values documented in the October 23 report; those earlier observations were not recaptured November 17. October 2026 was verified directly from InfoSparks on November 17, 2026. City geography, Residential, Average Sales Price, Monthly; all price ranges, bedrooms, lot sizes, construction types, styles, square footage, waterfront properties and sides. This broader series is not detached-only. Values can be revised.
Mortgage-rate context
The national 30-year fixed monthly mean rose from 6.86% in September to 7.33% in October 2026. These are calendar-month means of Freddie Mac weekly observations, not daily rates or personal loan quotes. Monthly price and rate movements do not establish causation; sale mix and closing timing matter.
The monthly rate table was independently checked against the Freddie Mac archive on November 10. For a current daily index, consult Mortgage News Daily; ask a lender for a quote for your circumstances.
November 13 daily mortgage-rate snapshot
The historical MND index for November 13, 2026 recorded a 7.50% 30-year fixed rate, up 0.08 percentage points from the prior reading. This is a dated national index, not a current quote.
Product | Rate | Daily change, percentage points |
|---|---|---|
30-year fixed | 7.50% | +0.08 |
15-year fixed | 7.03% | +0.03 |
30-year jumbo | 7.50% | +0.04 |
7/6 SOFR ARM | 7.13% | +0.08 |
30-year FHA | 7.05% | +0.05 |
30-year VA | 7.07% | +0.06 |
Source: MND historical daily table, November 13 row, checked November 17, 2026. Separate from the monthly Freddie Mac series; actual borrower quotes vary.
Detailed figures
Event | October 23, 2026 | November 13, 2026 | Raw change | Raw % change |
|---|---|---|---|---|
First Look | 1 | 1 | 0 | 0.0% |
Active | 16 | 9 | -7 | -43.8% |
Back on market | 1 | 2 | 1 | 100.0% |
Price reduced | 23 | 17 | -6 | -26.1% |
Price increased | 0 | 1 | 1 | N/A (new activity) |
Contingent | 0 | 0 | 0 | 0% |
Expired | 1 | 3 | 2 | 200.0% |
Pending | 5 | 15 | 10 | 200.0% |
Sold | 13 | 5 | -8 | -61.5% |
Canceled | 10 | 9 | -1 | -10.0% |
Zero in both reports is shown as 0%. Positive activity after zero is N/A (new activity). These are not adjacent-week changes.
Metric | October 2025 | September 2026 | October 2026 | Year over year | Month over month |
|---|---|---|---|---|---|
Average sold price | $1,730,950 | $1,574,923 | $1,537,795 | -11.2% | -2.4% |
Click Below To View Listings
These highlighted links are individual examples, not the entire selection. Additional matched addresses are listed below. Event categories refer to the November 13 snapshot; current availability may differ.
These addresses matched the November 6 onward Market Watch event selections at collection, not a count of unique current inventory. Public status and details may change. These links open the matching Team NSRG property pages.
Active
- 12516 231st Avenue NE
- 16406 NE 96th Place
- 2604 W Lake Sammamish Pkwy NE
- 18947 NE 68th Street
- 20215 NE 50th Street
- 13864 231st Lane NE
- 11758 168th Place NE
- 6133 141st Court NE
- 23150 NE 126th Street
First Look
Let’s talk about your Redmond options
As we traverse the market changes together, it is my intent that these market updates create an ever more accurate picture of market trends for you. Buying and selling real estate always requires an in-depth understanding of current market conditions and trends. It is my goal to help you understand these traits. My phone is always on and I love to talk shop. Don’t hesitate to reach out with your questions.
Sources and scope
Authenticated NWMLS Matrix Market Watch, collected approximately November 13, 2026 at 16:49 UTC. Displayed start November 6 onward; exact clock boundaries and 168-hour duration unavailable. Single Family / Residential; Washington; King County; MLS City Redmond; styles 10–18, 25 and 26; excluding Attached/Zero Lot Line and Incomplete. MLS city fields do not independently establish municipal boundaries. Status events overlap and are not unique inventory counts.
October 23 published report: displayed October 16 onward, collected 8:51 a.m. PDT. It describes detached-style Residential excluding attached/zero-lot-line and Incomplete. Exact original clocks and complete filter evidence were not recovered. No comparable immediately preceding seven-day baseline was verified; the older report is nonadjacent historical context.
InfoSparks price observations and mortgage-rate sources are documented beside the monthly table. The October price endpoint was reverified November 17, 2026. Unverified chart-coordinate-derived nonprice figures are omitted. Artwork is illustrative.