

TEAM NSRG | NOVEMBER 5, 2026
Historical market snapshot collected November 5, 2026. Rates and market figures below are dated; the separately labeled listing examples were checked November 17.
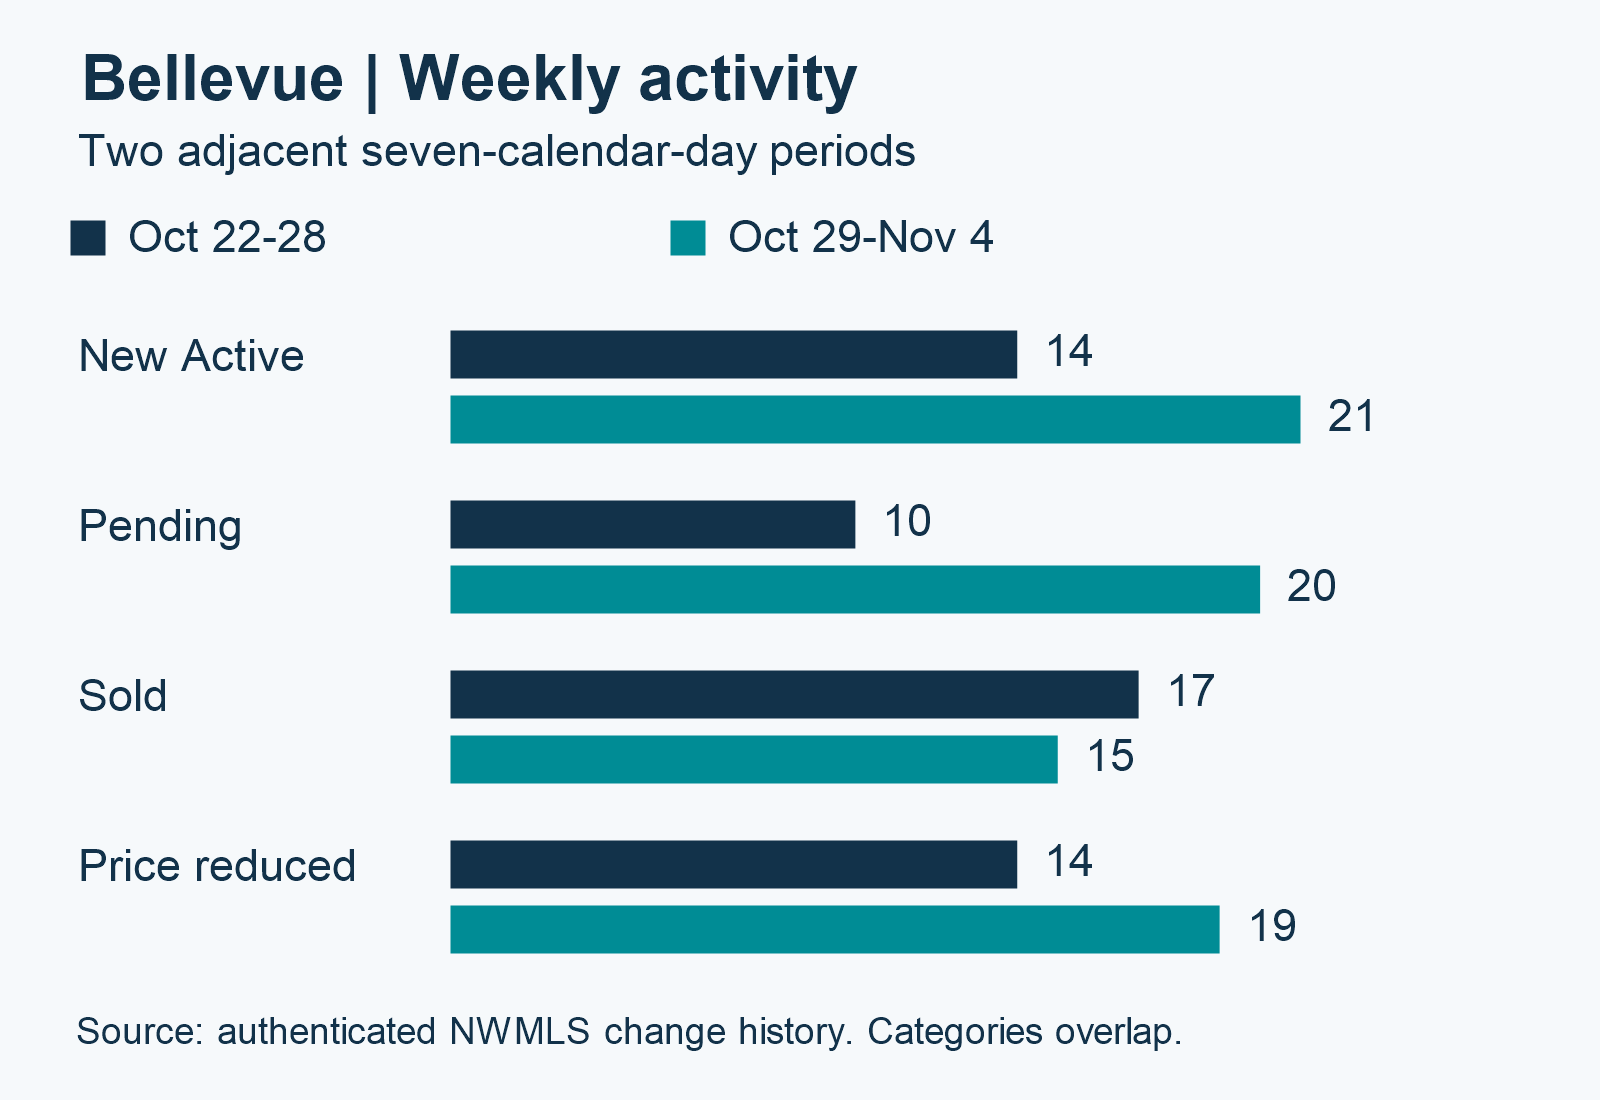
Detached-home activity for October 29-November 4, compared with October 22-28.
What changed this week
Pending activity increased from 10 to 20 listings, while New Active activity increased from 14 to 21. Price reductions also rose, from 14 to 19. The combination points to a market with both fresh options and continued price adjustments, rather than one uniform experience for every home.
What it means for your next move
Buyers can use the additional new activity to compare location, condition and total monthly cost. Sellers should watch the competing homes in their own price range: more pending activity across Bellevue does not mean every asking price will attract an offer. Sold activity eased from 17 to 15, and these closings reflect agreements made earlier.
October price context
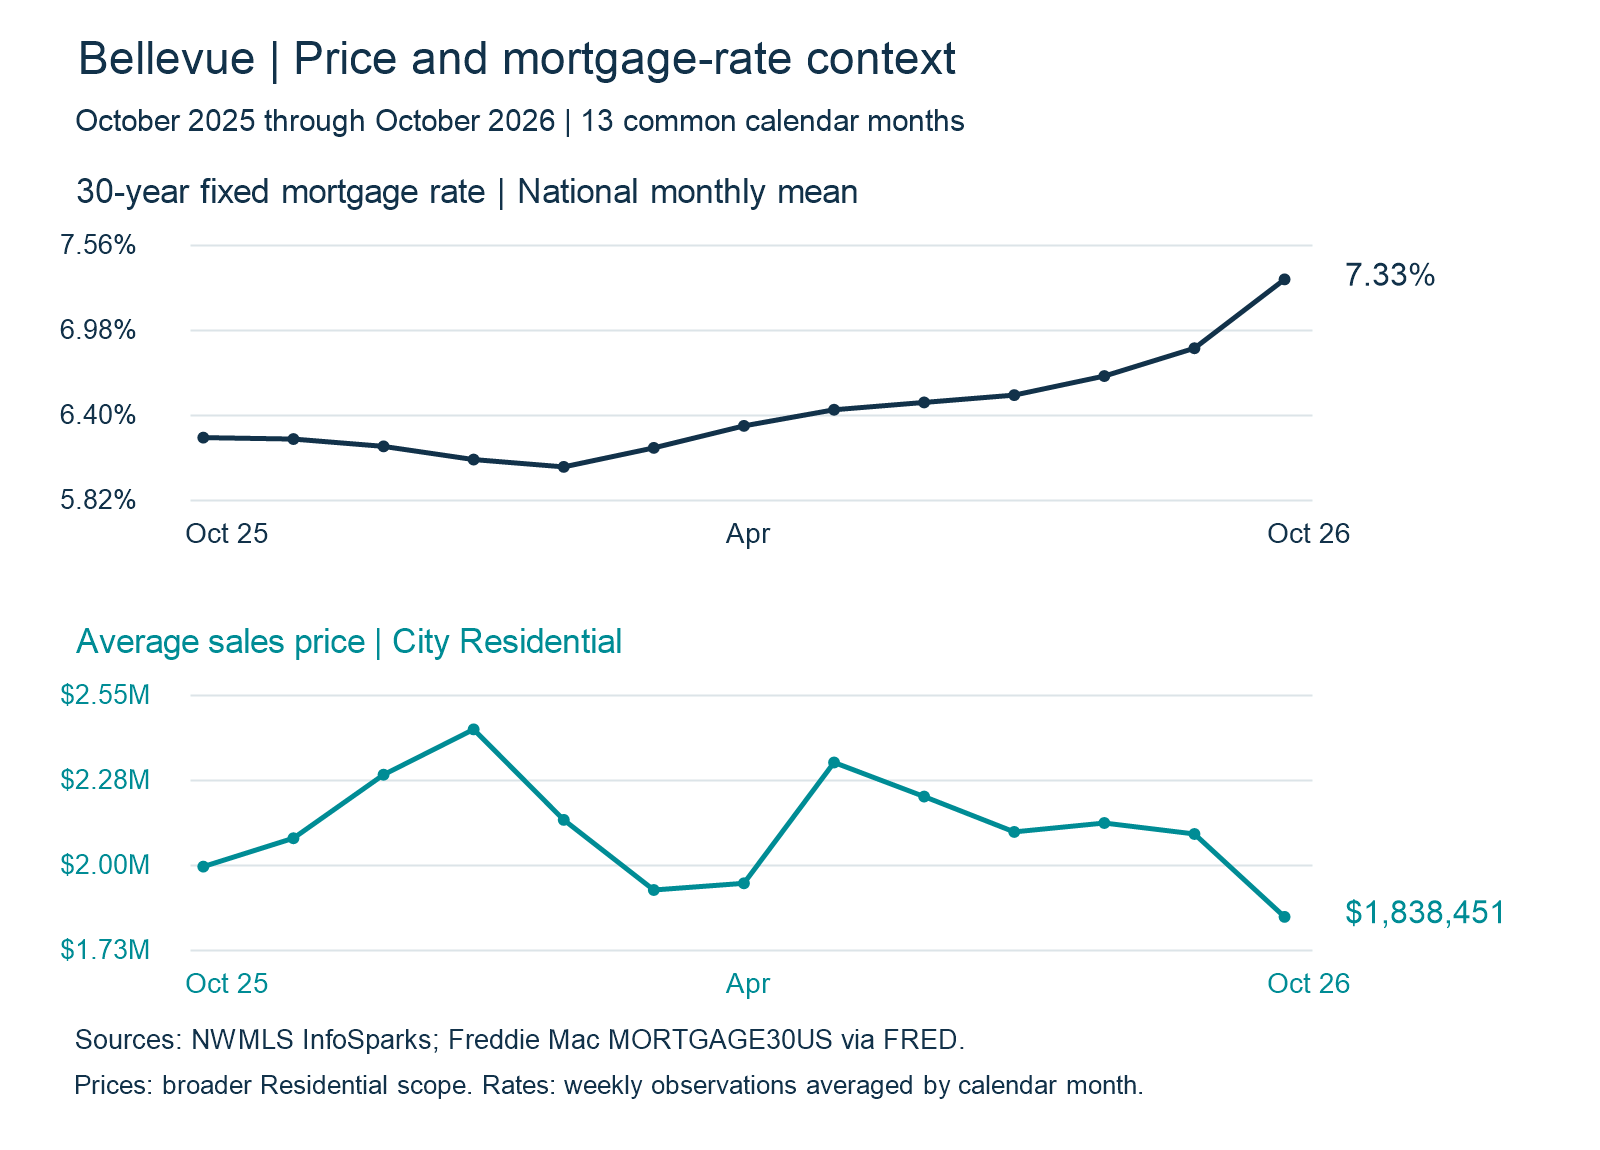
InfoSparks reports an October 2026 average sales price of $1,838,451 for Bellevue Residential properties. This monthly series covers a broader Residential group than the detached-only weekly activity above. An average can shift with the mix of homes that close; it is not an estimate of an individual home's value.
Thirteen months in context
October's average sales price was 8.1% lower than October 2025 and 12.7% lower than September 2026. The national monthly mortgage-rate mean was 7.33%, compared with 6.86% in September. These separate series provide context; their movement does not establish that one caused the other.
Mortgage News Daily rate snapshot
November 5, 2026. Dated national index, not a live widget or personalized quote.
Product | Rate |
|---|---|
30-year fixed | 7.17% |
Daily change for November 5: -0.05 percentage points.
View live Mortgage News Daily rates · View daily rate movement
See exact monthly rates and average sales prices
Month | 30-year fixed rate |
|---|---|
October 2025 | 6.25% |
November 2025 | 6.24% |
December 2025 | 6.19% |
January 2026 | 6.10% |
February 2026 | 6.05% |
March 2026 | 6.18% |
April 2026 | 6.33% |
May 2026 | 6.44% |
June 2026 | 6.49% |
July 2026 | 6.54% |
August 2026 | 6.67% |
September 2026 | 6.86% |
October 2026 | 7.33% |
Month | Average sales price |
|---|---|
October 2025 | $2,000,909 |
November 2025 | $2,092,754 |
December 2025 | $2,298,059 |
January 2026 | $2,444,481 |
February 2026 | $2,152,104 |
March 2026 | $1,925,358 |
April 2026 | $1,946,975 |
May 2026 | $2,337,571 |
June 2026 | $2,227,412 |
July 2026 | $2,113,163 |
August 2026 | $2,141,897 |
September 2026 | $2,106,492 |
October 2026 | $1,838,451 |
Rates: arithmetic mean of Freddie Mac weekly MORTGAGE30US observations within each calendar month, percent, not seasonally adjusted, shown to two decimals. FRED series and Freddie Mac archive. Prices: authenticated InfoSparks chart tooltips, captured November 5.
Freddie Mac weekly context
On November 5, Freddie Mac's weekly 30-year fixed survey was 7.18%. It uses a different survey method from Mortgage News Daily and should be read separately. Confirm the rate, points and total costs for your own loan with your lender.
Freddie Mac weekly series through FRED | Mortgage News Daily's current rate index
Click Below To View Listings
Current Examples Checked November 17, 2026
These examples are separate from the historical market report above. They were verified in the current Bellevue detached-home search on November 17, not identified as members of the October 29–November 4 event sets. Availability and prices can change.
View 4110 146th Avenue SE on Team NSRG
MLS #2596709 · Active · $1,348,000 when checked November 17
First Look Listings
This is a current November 17 First Look example, not one of the two historical First Look events counted above. A matching Team NSRG destination was not found; the link opens Redfin. Confirm availability and timing before making plans.
Explore 16032 Main Street on Redfin
MLS #2603813 · First Look in Matrix / Coming Soon on Redfin · $1,025,000 when checked November 17
Current listing scope: NWMLS Matrix, Bellevue City, King County, Residential, styles 10–18, 25 and 26; Attached/Zero Lot Line excluded. Current status selection, no entry-date restriction. Selected examples only, not all newly listed homes.
Let's talk through your Bellevue move
See the complete weekly activity table
On a phone, swipe the table sideways to see all columns.
Activity | Oct 22-28 | Oct 29-Nov 4 | Change | Change % |
|---|---|---|---|---|
First Look | 1 | 2 | +1 | +100.0% |
New Active activity | 14 | 21 | +7 | +50.0% |
Back on Market | 4 | 2 | -2 | -50.0% |
Price Reduced | 14 | 19 | +5 | +35.7% |
Price Increased | 0 | 0 | 0 | 0.0% |
Contingent | 0 | 0 | 0 | 0.0% |
Expired | 5 | 14 | +9 | +180.0% |
Pending | 10 | 20 | +10 | +100.0% |
Sold | 17 | 15 | -2 | -11.8% |
Canceled | 12 | 8 | -4 | -33.3% |
Bellevue's increase in pending activity came alongside more price reductions, so the homes competing in your price range matter more than a single citywide label. If you're weighing a purchase or sale in Bellevue, I'm happy to help you connect these numbers with the homes and neighborhoods that matter to you. Reach me at 206-349-9748 or [email protected].
Jeremy Minor
Team NSRG