
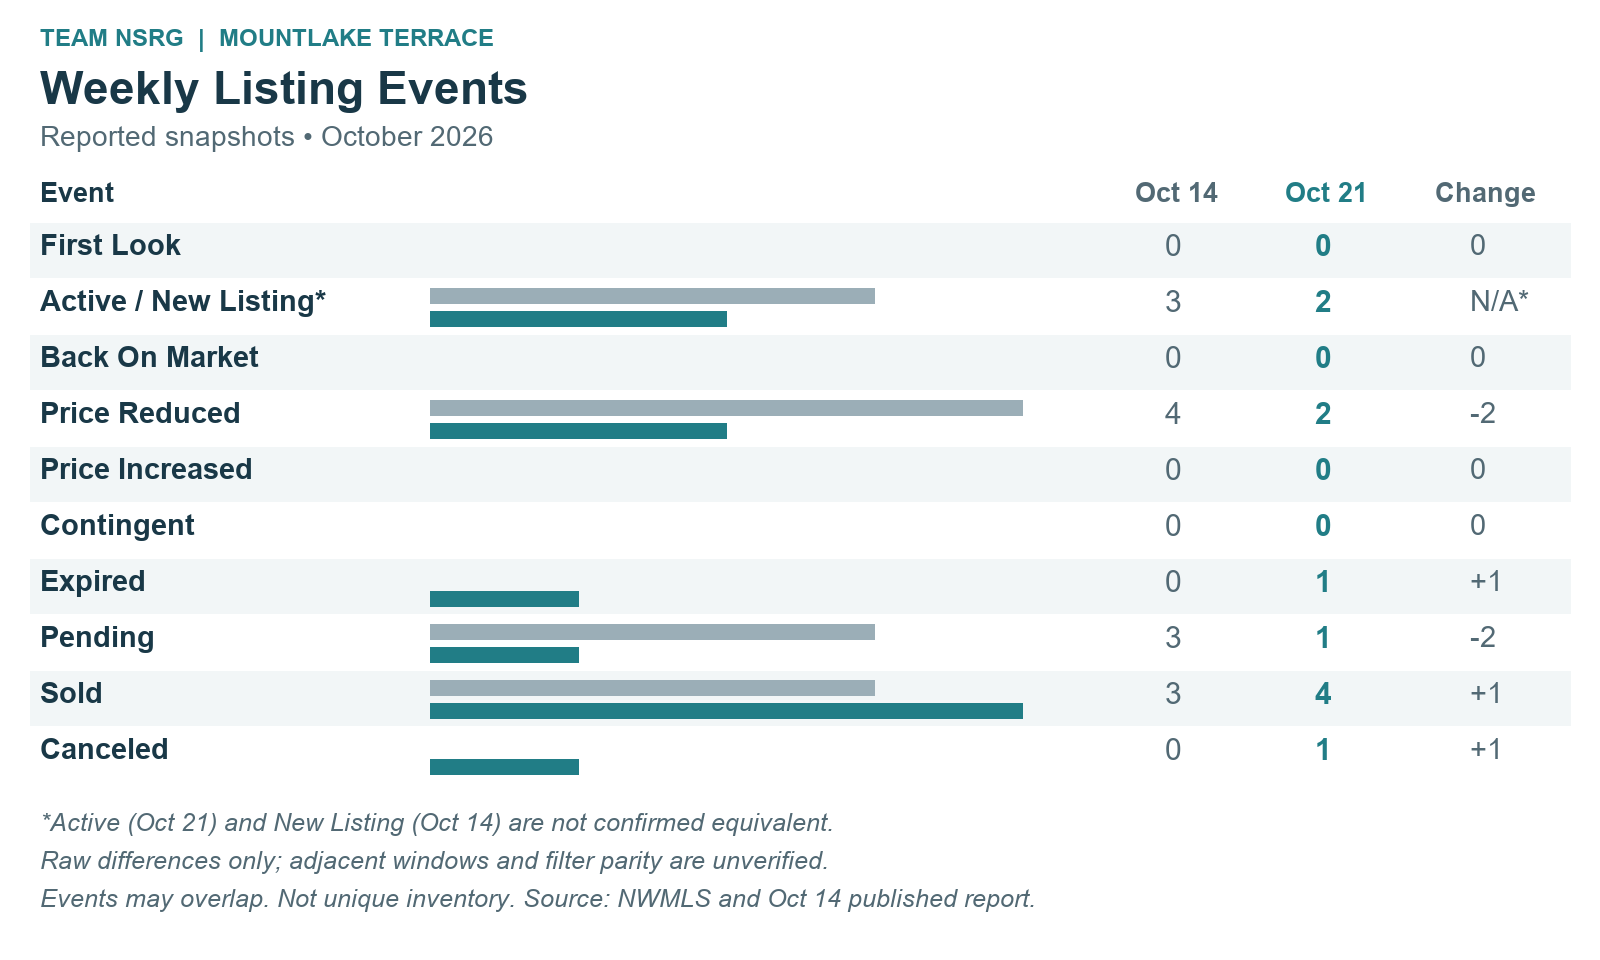
Keep your home search focused on fit, condition and price. Mountlake Terrace's October 21 seven-day report recorded two Active listing events, two price reductions, one pending event and four sold events. For buyers, the price changes are a reason to revisit homes that fit your needs. For sellers, they are a reminder to compare your asking price with the alternatives buyers can see today.
For buyers: Compare nearby homes with similar size, condition and features. A lower asking price can make a home worth another look, but the monthly payment and the work it needs still matter.
For sellers: Make the home easy to show, take care of noticeable repairs and use comparable sales to set your price. The pending event shows that a buyer moved forward; this small weekly snapshot alone does not tell us whether demand is speeding up or slowing down.
This Week's Listing Activity
October 21, 2026 - NWMLS Matrix 7 Day view
Open full-size weekly chart · Open larger-label mobile chart
Listing event | Oct 14 published snapshot | Oct 21 snapshot | Raw difference |
|---|---|---|---|
First Look | 0 | 0 | 0 |
Active / New Listing* | 3 | 2 | Not comparable |
Back On Market | 0 | 0 | 0 |
Price Reduced | 4 | 2 | -2 |
Price Increased | 0 | 0 | 0 |
Contingent | 0 | 0 | 0 |
Expired | 0 | 1 | +1 |
Pending | 3 | 1 | -2 |
Sold | 3 | 4 | +1 |
Canceled | 0 | 1 | +1 |
These are two reported snapshots, not a validated comparison of adjacent, non-overlapping weeks. The prior report covered October 7 onward through October 14 at 10:42 a.m. Pacific; the current query shows October 14 onward, captured October 21 at 8:40 a.m. Pacific. Exact clock cutoffs and identical filters are unconfirmed. Active and New Listing have not been confirmed equivalent, so no change is calculated for that row. Other differences are raw count differences, not measures of market acceleration. Events can overlap and are not unique inventory.
A Look At September
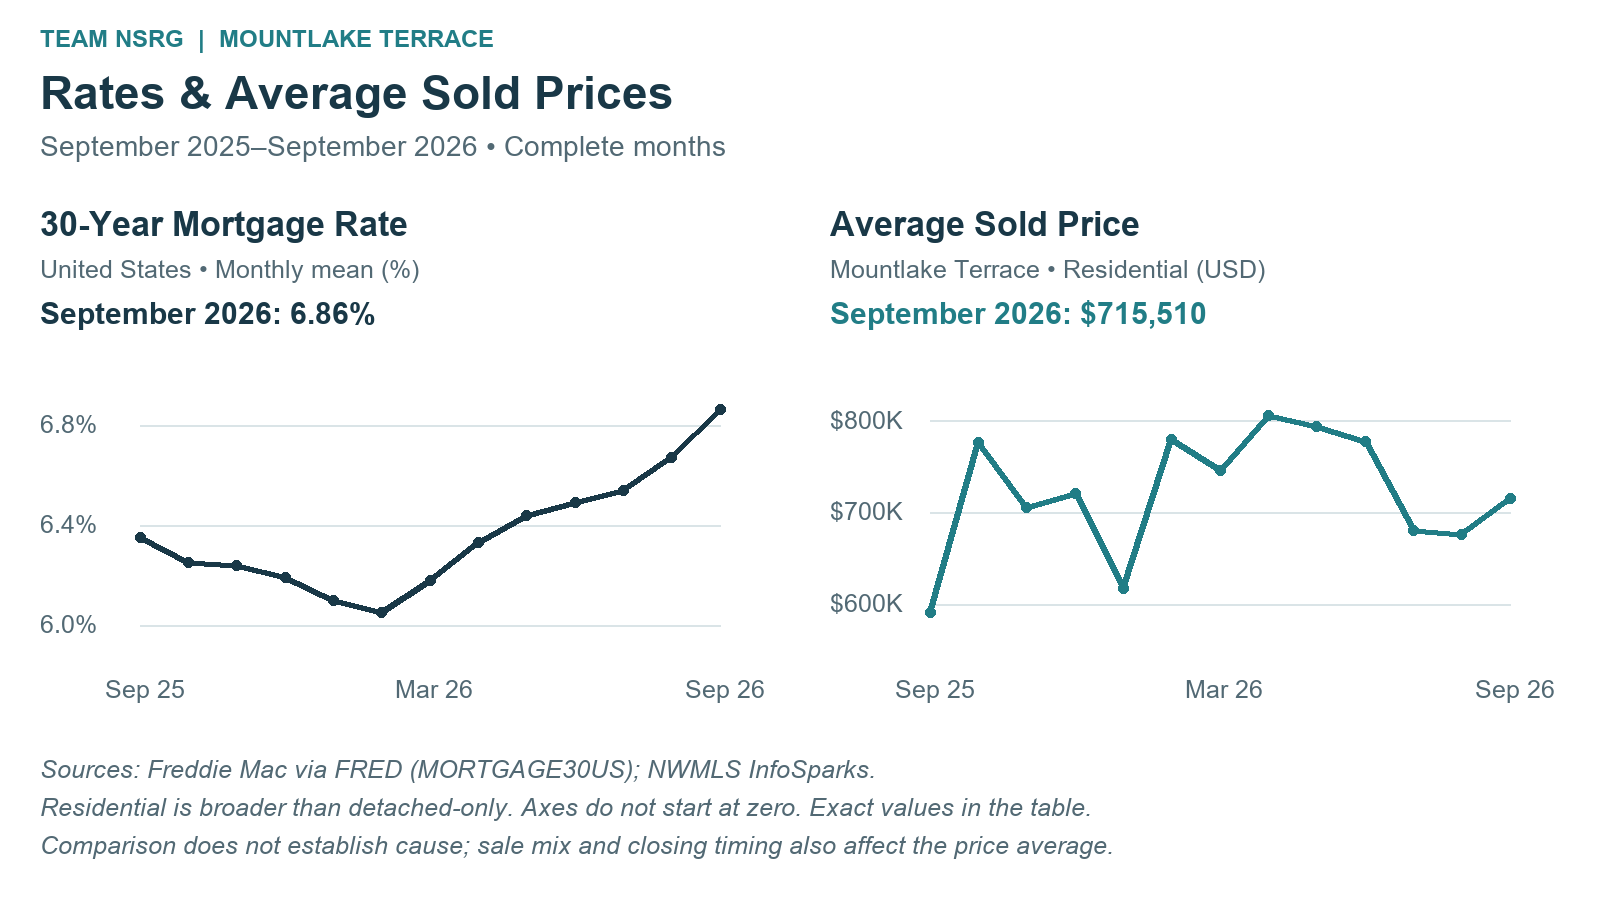
Mountlake Terrace's average sold price was $715,510 in September 2026, up 5.8% from August's $676,250 and 21.1% from September 2025's $590,698. These monthly figures cover the broader Residential category.
An average adds the prices of the homes that sold and divides by the number of sales. The homes selling each month change, so this increase does not mean every home gained 21.1% in value. Recent sales of homes similar to yours are a better starting point.
September had 15 completed sales, compared with eight in August and seven a year earlier. There were 22 homes for sale, compared with 23 in August and 20 in September 2025. Homes that sold spent an average of 24 days on the market: longer than August's 13 days, but shorter than the 37 days recorded a year earlier.
Measure | September 2025 | August 2026 | September 2026 |
|---|---|---|---|
Average sold price | $590,698 | $676,250 | $715,510 |
Closed sales | 7 | 8 | 15 |
Homes for sale | 20 | 23 | 22 |
Average days on market, sold homes | 37 | 13 | 24 |
Months of supply, closed-sales measure | 2.0 | 2.1 | 1.9 |
Months of supply estimates how long the available homes would last at the report's sales pace. It does not predict how long an individual home will take to sell. For your own decision, compare the homes available in your price range and the recent sales most like the home you want to buy or sell.
Mortgage Rates And Home Sale Prices
The national 30-year fixed mortgage rate averaged 6.86% in September, compared with 6.67% in August and 6.35% in September 2025. Those are increases of 0.19 and 0.51 percentage points, respectively. The monthly averages come from the FRED MORTGAGE30US series.
Mountlake Terrace's average sold price also rose from August to September. Seeing both figures together is a useful reminder to compare payments as well as prices. It does not show that mortgage rates caused the price change: the mix of homes sold and the timing of closings also affect a monthly average.
Open the full-size desktop chart · Open the larger-label mobile chart
Current Mortgage Rate Environment
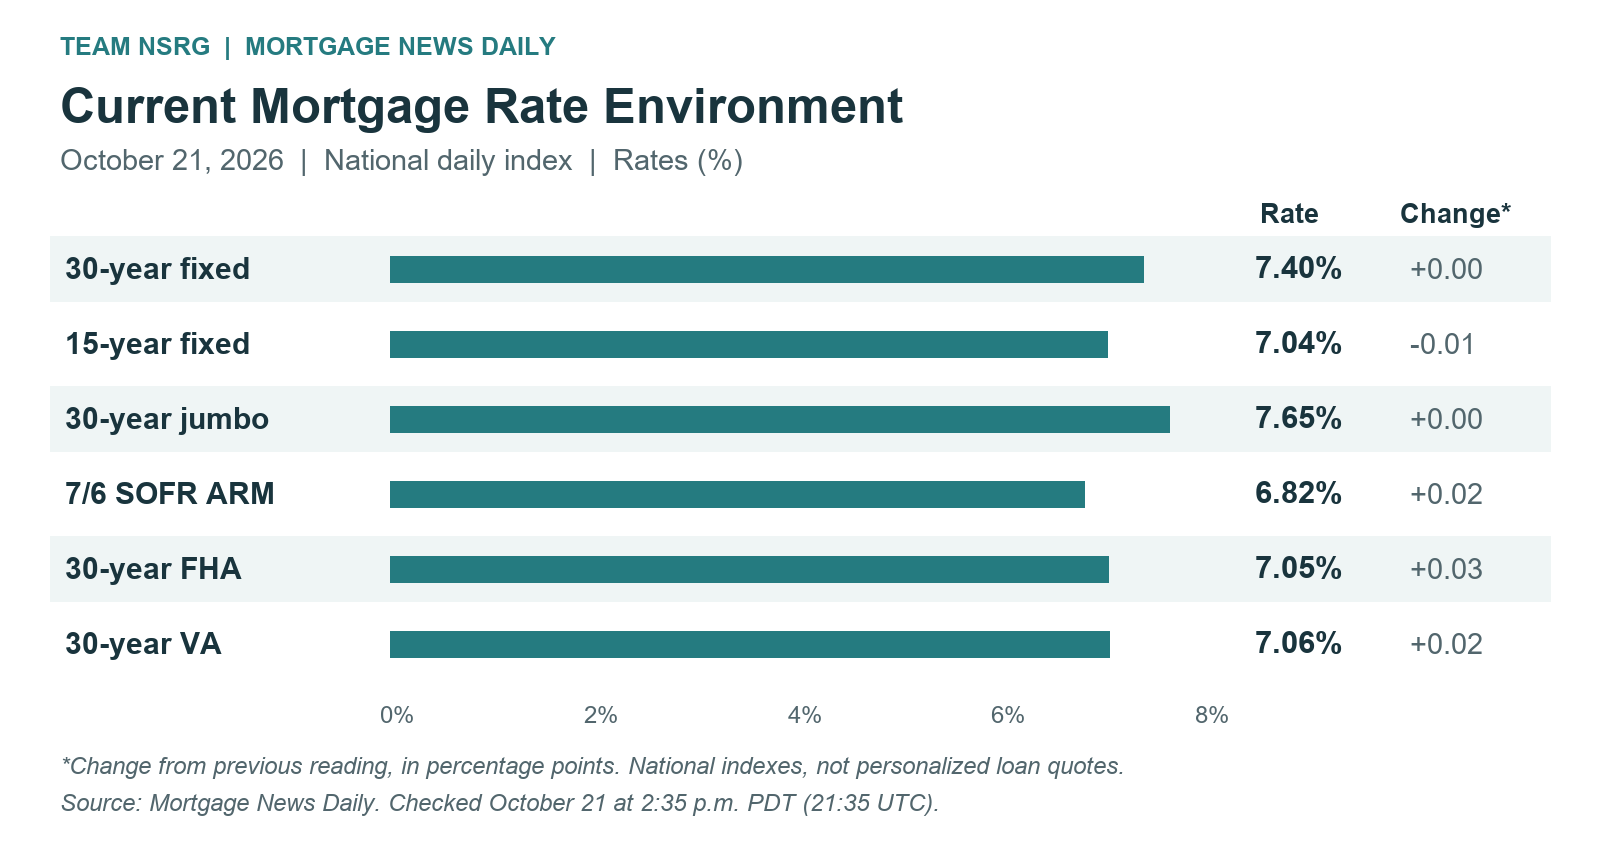
Mortgage News Daily’s October 21 national daily index ended at 7.40% for a 30-year fixed mortgage, unchanged from the previous reading, after an earlier dip. This daily snapshot is separate from the monthly FRED averages above. Compare the full payment and loan terms with your lender; these indexes are not personalized loan quotes.
Open full-size current-rate graph · Live mortgage-rate dashboard · MND daily index
Loan product | Rate | Change (pp) |
|---|---|---|
30-year fixed | 7.40% | 0.00 |
15-year fixed | 7.04% | -0.01 |
30-year jumbo | 7.65% | 0.00 |
7/6 SOFR ARM | 6.82% | +0.02 |
30-year FHA | 7.05% | +0.03 |
30-year VA | 7.06% | +0.02 |
Source: Mortgage News Daily, October 21, 2026 daily index; checked at 2:35 p.m. PDT (21:35 UTC). Changes are percentage points from the previous reading. National rate indexes differ from APRs, lender offers and the monthly FRED series. Read the day’s rate commentary.
Click Below to View Listings
The October 21, 8:40 a.m. Pacific snapshot recorded no First Look listings.
View the Three Homes in the Current Seven-Day Active Event Set
Listing set checked October 21 at 11:15 AM Pacific: three Mountlake Terrace listings matched the seven-day Active-event query with the detached-home filters described below. This later check differs from the two Active events recorded in the 8:40 a.m. snapshot above. This is a saved selection of listings, not a rolling seven-day search; listing availability can change.
Current Mountlake Terrace Homes for Sale
This live city search includes multiple property types and is not restricted to the seven-day detached-home event report. Results change as listings change.
Frequently Asked Questions
Are homes selling faster than last week?
The prior published snapshot recorded three pending and three sold events, compared with one pending and four sold now. The reporting windows and filters are not proven identical, and closings follow earlier contracts, so these counts do not establish a change in selling speed.
Does the higher average sold price tell me what my home is worth?
It gives citywide context. The mix of homes sold can move the average, especially with a small number of sales. Compare recent sales with similar location, size and condition to evaluate an individual home.
Where should I start?
Start with your budget, timing and the features that matter most. Jeremy Minor and Team NSRG can help you compare suitable homes and nearby sales with your plans in mind.
Sources And Scope
Weekly: NWMLS Matrix Market Watch, 7 Day view, collected October 21, 2026 at 8:40 a.m. Pacific (15:40 UTC). The displayed boundary was “10/14/2026+”; exact clock cutoffs were not exposed. Filters: Washington, Snohomish County, Mountlake Terrace MLS city, Single Family/Residential, detached-home property filters; Attached/Zero Lot Line and Incomplete excluded. No map, area, community, ZIP, price, year, broker or office restriction. Categories can overlap; the prior published snapshot is shown with the comparison limits stated above.
Monthly: NWMLS InfoSparks, Mountlake Terrace (City), Monthly, broader Residential category, all saved property filters unrestricted. Exact date/value tooltips were captured October 21, 2026, approximately 15:36–15:39 UTC. Complete months only. InfoSparks source.
Rates: FRED MORTGAGE30US, US, percent, not seasonally adjusted; calendar-month arithmetic means of weekly observations. The 13 monthly values were validated against 56 weekly observations. MND: October 21 daily index, checked at 2:35 p.m. PDT (21:35 UTC).
Prior snapshot: October 14 Mountlake Terrace update.
Let's Talk About Your Next Move
Mountlake Terrace’s latest snapshot recorded two Active listing events, two price reductions, one pending event and four sold events, while September’s average sold price of $715,510 covers the broader Residential market. Keep your focus on fit, condition and the full monthly payment rather than treating this small snapshot as a lasting trend. If you are considering buying or selling, I would be happy to discuss your options and help you compare suitable homes, nearby sales and a plan that fits your timing and budget.