
Wednesday, October 14, 2026 | Jeremy Minor, Team NSRG

Four asking-price reductions stood out in this week's Mountlake Terrace detached-home snapshot. The same search recorded three new-listing events, three pending events, and three sold events. It is a small sample, but it gives buyers a reason to revisit listings and sellers a reason to keep an eye on current competition.
Seven-Day Mountlake Terrace Detached-Home Activity
NWMLS Market Watch 7 Day view, October 7 through retrieval on October 14, 2026. Selected Residential house styles, with Attached/Zero Lot Line excluded; all prices.
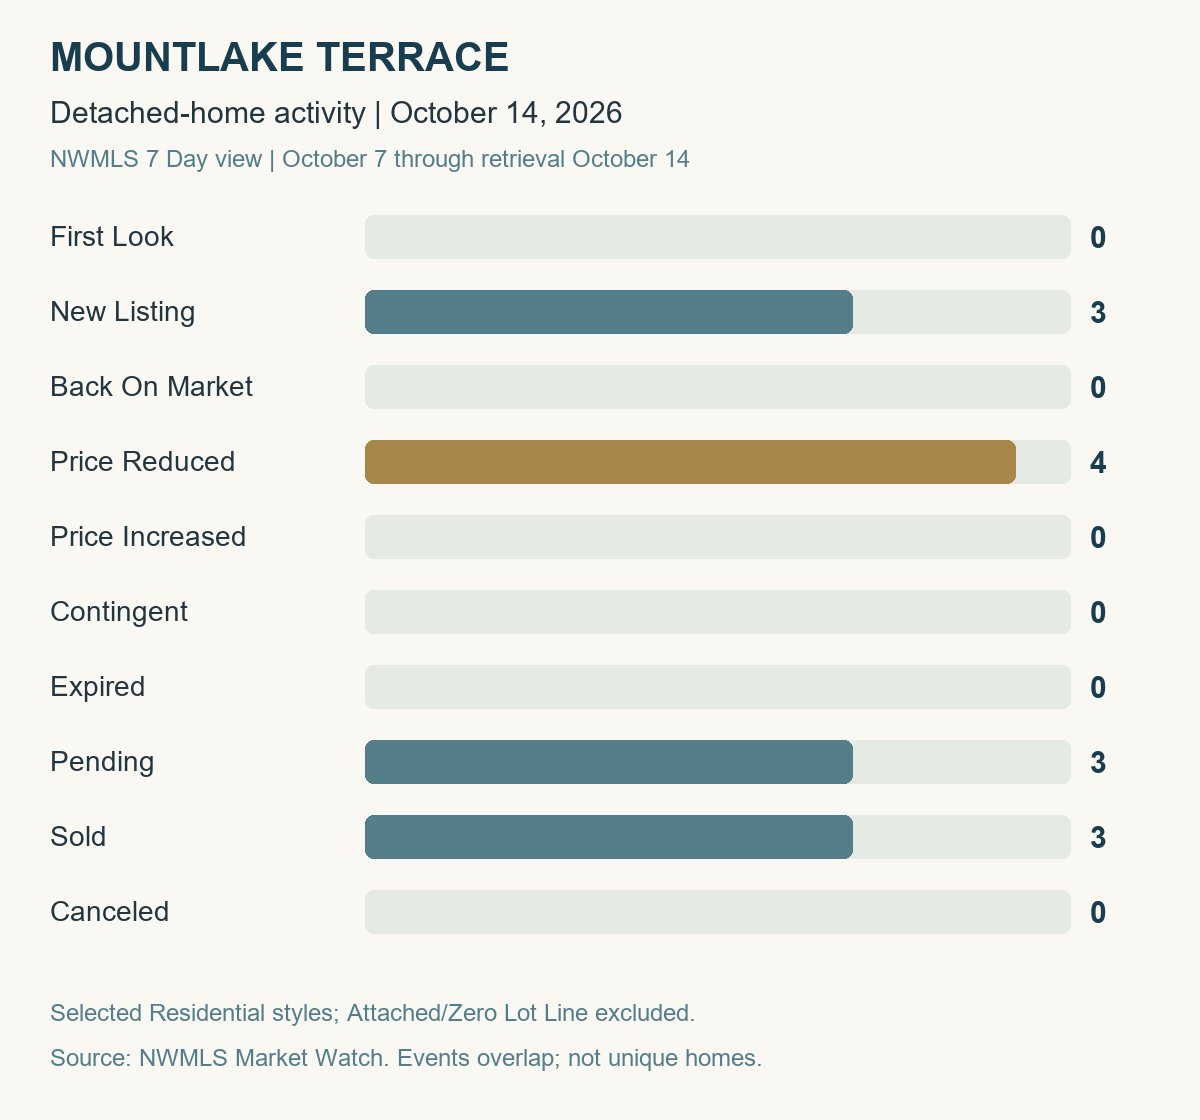
Category | Events |
|---|---|
First Look | 0 |
New Listing | 3 |
Back On Market | 0 |
Price Reduced | 4 |
Price Increased | 0 |
Contingent | 0 |
Expired | 0 |
Pending | 3 |
Sold | 3 |
Canceled | 0 |
Categories can overlap. Do not add them together as unique homes or current inventory. New Listing is a listing-change category, not the total number of active listings.
Some sellers are adjusting their asking prices while other homes are finding buyers. That does not mean every seller will negotiate, or that the homes going pending were the ones with reductions. No First Look, back-on-market, price-increase, contingent, expired, or canceled events appeared in this snapshot. A zero describes this query and reporting window, not a permanent market condition.
September Market Context
The monthly figures below use the broader InfoSparks Residential category for Mountlake Terrace City, with all styles, prices, and construction types. They do not reproduce the weekly detached-home search.
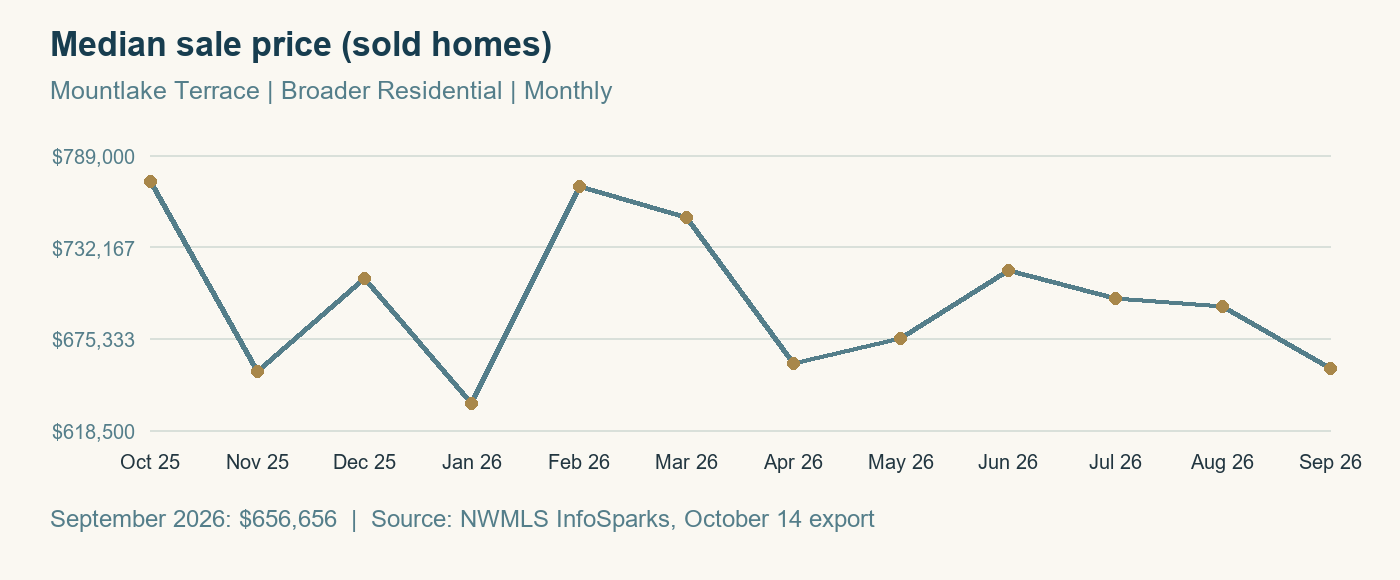
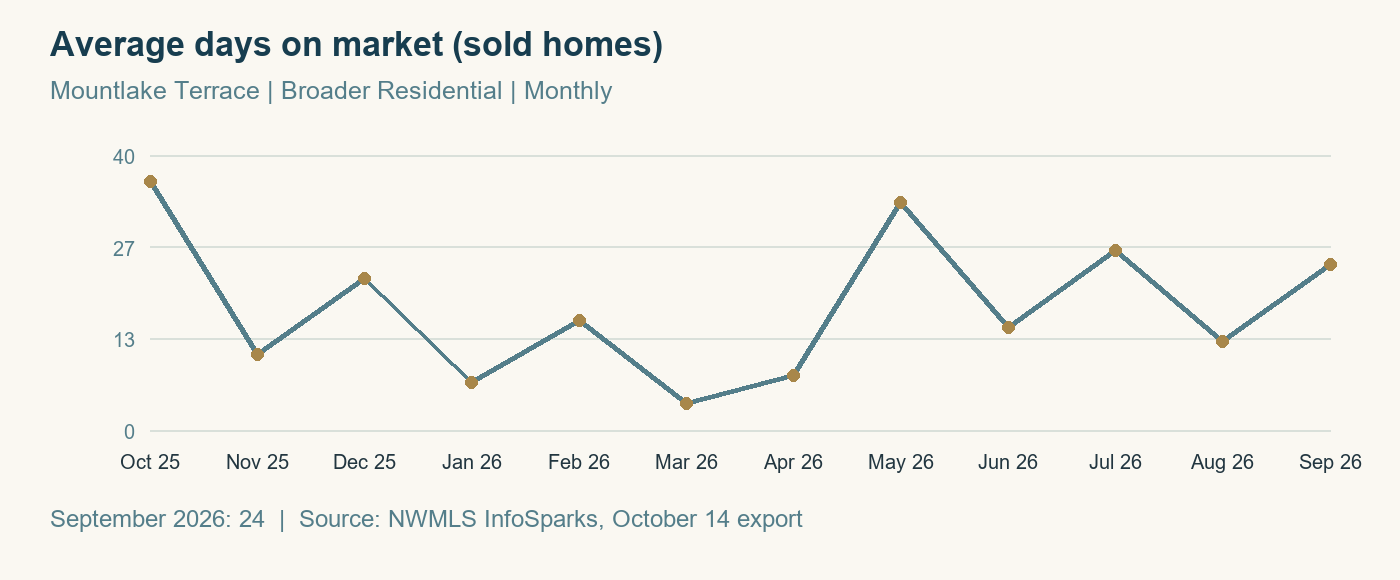
Median sale price and average days on market describe homes that closed during the reporting month, not homes still listed for sale. For those sold homes, days on market measures the time from listing to offer acceptance.
Metric | Sep 2025 | Aug 2026 | Sep 2026 | Year Over Year | Month Over Month |
|---|---|---|---|---|---|
Median sale price (sold homes) | $585,000 | $695,000 | $656,656 | +12.2% | -5.5% |
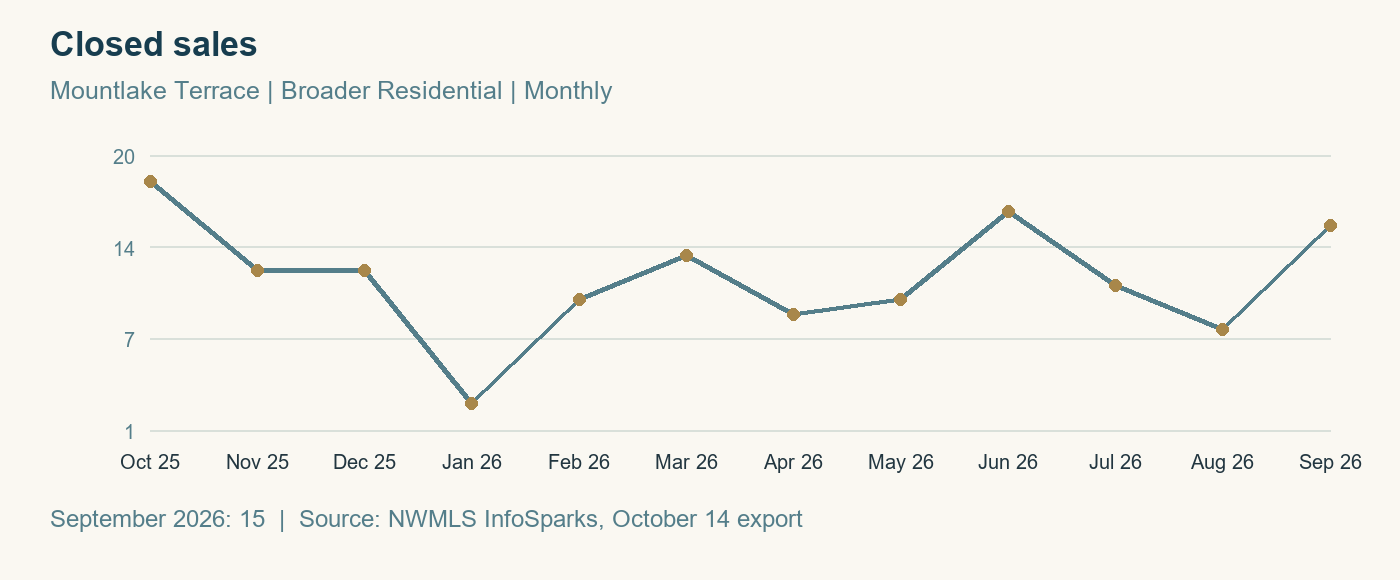
Closed sales | 7 | 8 | 15 | +114.3% | +87.5% |
Average days on market (sold homes) | 37 | 13 | 24 | -35.1% | +84.6% |
Months supply (closed-sales basis) | 2.0 | 2.1 | 1.9 | -5.0% | -9.5% |
Average sale price / original list price | 95.5% | 98.9% | 99.3% | +3.8 pp | +0.4 pp |
Changes are relative percentages except pp, which means percentage points for the original-list-price ratio.
September's broader Residential median sale price was $656,656, up 12.2% from September 2025 and down 5.5% from August 2026. There were 15 closed sales, compared with seven a year earlier and eight in August. With a modest number of sales, the mix of homes that closed can noticeably move the median. This is not an estimate of how much every home gained or lost in value.
Average days on market for sold homes was 24, compared with 37 last September and 13 in August. Months of supply was 1.9, below both last September's 2.0 and August's 2.1. The average sale price was 99.3% of original list price. These measures show why it helps to look at price, pace, and available choices together: the monthly picture does not point in just one direction.
Twelve Months Of Local Context
October 2025 through September 2026. Broader Residential, monthly values; not rolling averages. Select a chart to open the full-size image.
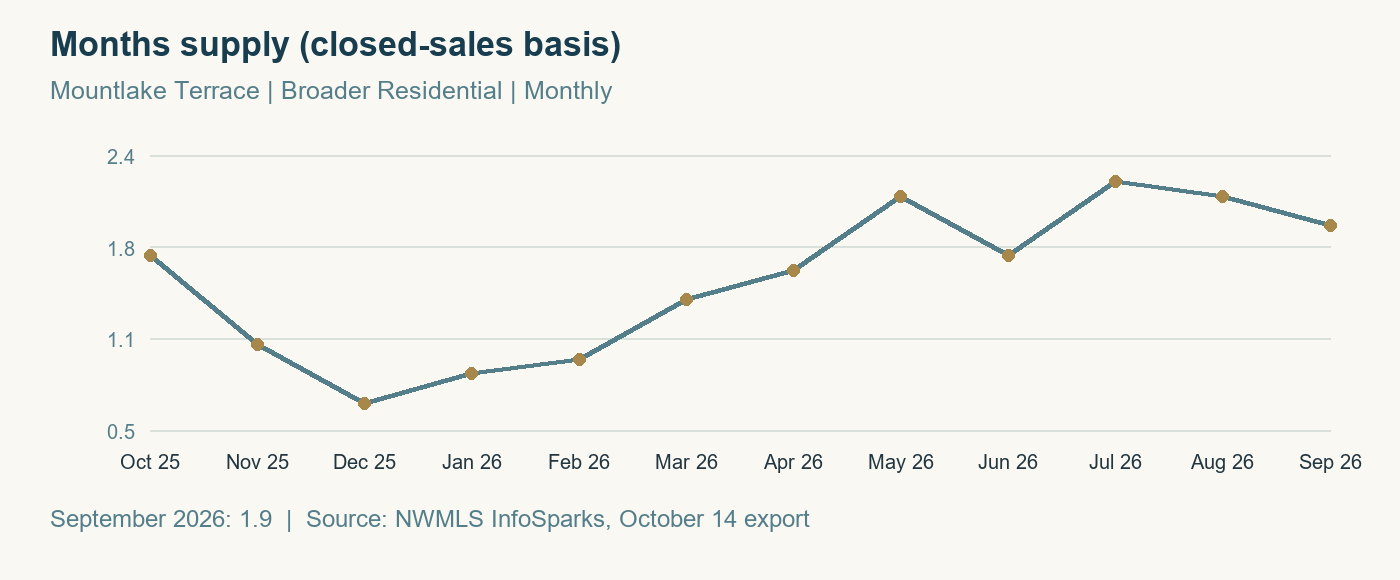
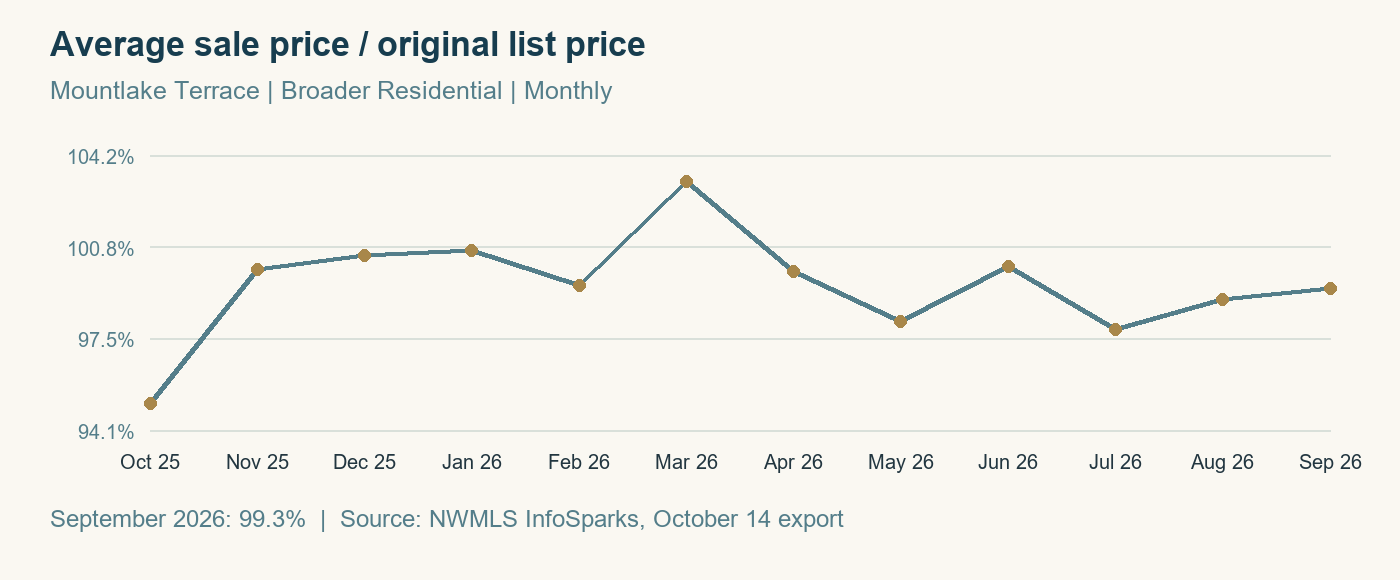
Accessible Monthly Chart Data
Month | Median sale price (sold homes) | Closed sales | Average days on market (sold homes) | Months supply (closed-sales basis) | Average sale price / original list price |
|---|---|---|---|---|---|
October 2025 | $772,500 | 18 | 36 | 1.7 | 95.1% |
November 2025 | $654,975 | 12 | 11 | 1.1 | 100.0% |
December 2025 | $712,500 | 12 | 22 | 0.7 | 100.5% |
January 2026 | $635,000 | 3 | 7 | 0.9 | 100.7% |
February 2026 | $769,250 | 10 | 16 | 1.0 | 99.4% |
March 2026 | $750,000 | 13 | 4 | 1.4 | 103.2% |
April 2026 | $660,000 | 9 | 8 | 1.6 | 99.9% |
May 2026 | $675,000 | 10 | 33 | 2.1 | 98.1% |
June 2026 | $717,500 | 16 | 15 | 1.7 | 100.1% |
July 2026 | $700,000 | 11 | 26 | 2.2 | 97.8% |
August 2026 | $695,000 | 8 | 13 | 2.1 | 98.9% |
September 2026 | $656,656 | 15 | 24 | 1.9 | 99.3% |
What This Means For Buyers
If you are looking in Mountlake Terrace, compare the homes that fit your needs with recent sales and today's alternatives. A price reduction may make a property worth another look. Check its condition, location, listing history, and full monthly ownership cost before deciding what an offer should look like.
What This Means For Sellers
If you are preparing to sell, pay attention to the homes buyers can choose from now and the ones that have just gone pending. A thoughtful price and good preparation still matter. Use showing feedback and comparable homes to decide whether an adjustment is needed.
Market Conclusion
In conclusion, I think Mountlake Terrace is working toward a more balanced market, even if the shift is uneven. This week brought three new-listing events, four price reductions, and three pending events. Buyers are looking for choices and negotiating room, while Sellers are trying to find the price that brings the right Buyer through the door. September’s broader Residential figures showed 1.9 months of supply, so I would be careful about calling this an oversupplied market. Average 30 year fixed rates continue to hover at around 7.50% (according to Mortgage News Daily). Inflation continues to push up everyday costs and erode purchasing power. In my opinion, the seasonal shift may give both sides room to reassess. Some owners may have enough equity and flexibility to wait, though these numbers do not tell us how much equity they hold or why they delay selling. If rates rise further, affordability could keep some Buyers cautious. If rates ease, demand could pick up in January 2027—but that will also depend on inventory and Buyers’ confidence. Only time will tell.
Let’s Talk About Your Next Move
As we navigate these market changes together, my goal is for these updates to give you an increasingly clear picture of local trends. Buying and selling real estate takes an in-depth understanding of current conditions and where the market is heading. I'm here to help you make sense of both. My phone is always on, and I love to talk shop. Don't hesitate to reach out with your questions.
Jeremy Minor | Team NSRG | [email protected] | 206-349-9748