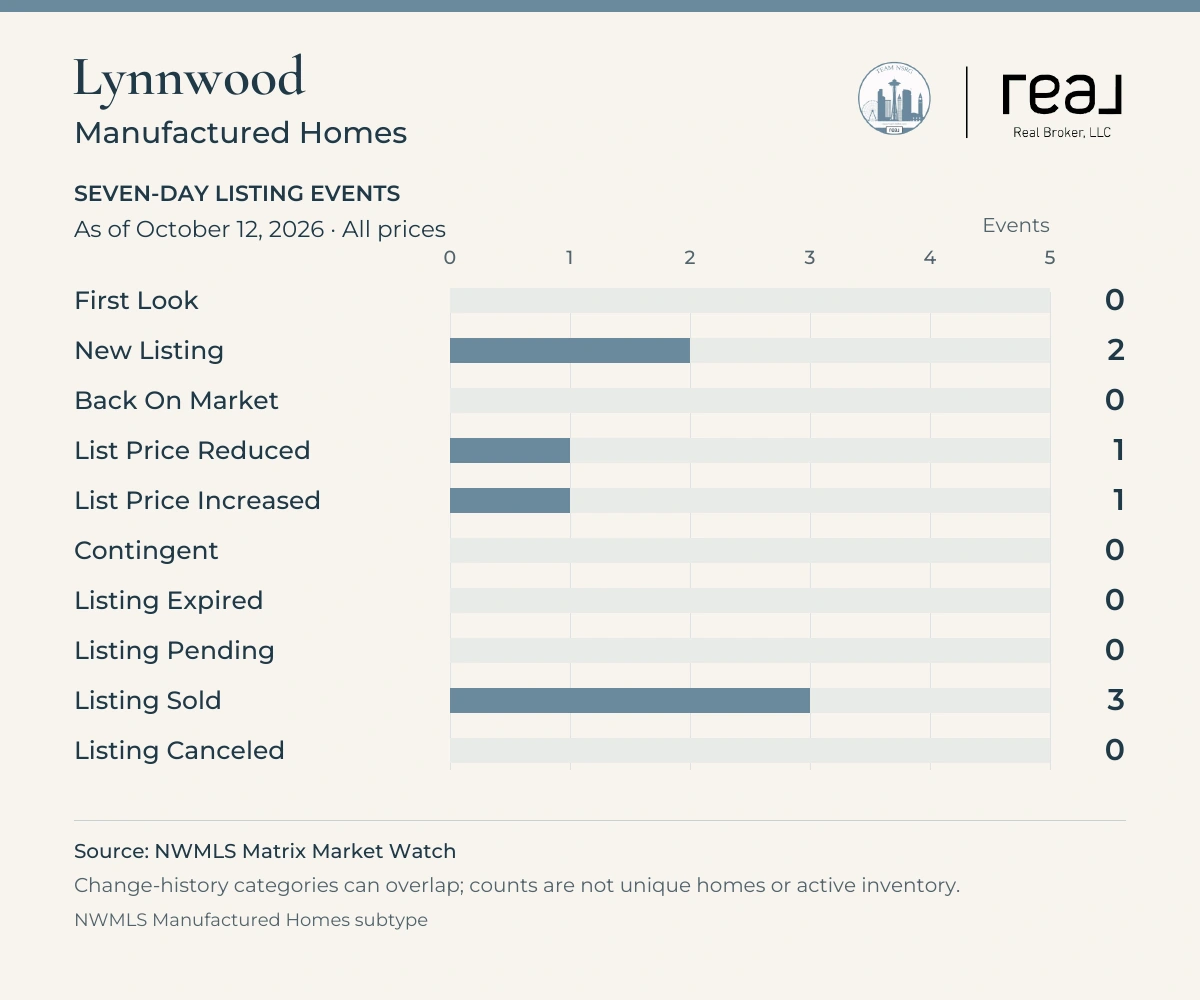
Lynnwood’s Manufactured Homes search recorded two new listing events and three sold events in the latest seven-day view. There was also one price reduction and one price increase. With a small snapshot like this, the details of each home matter a lot.
This report uses the exact NWMLS Manufactured Homes subtype in the Lynnwood City field, across all prices.
Seven day Lynnwood manufactured homes activity
NWMLS 7 Day view beginning October 5, 2026, through retrieval October 12, 2026.
View the mobile-friendly chart
Market Watch category | Events |
|---|---|
First Look | 0 |
New Listing | 2 |
Back On Market | 0 |
List Price Reduced | 1 |
List Price Increased | 1 |
Contingent | 0 |
Listing Expired | 0 |
Listing Pending | 0 |
Listing Sold | 3 |
Listing Canceled | 0 |
These are Market Watch change-history events. A property can appear in more than one category. The rows should not be added together as a count of unique properties or used to calculate inventory, absorption or a sold percentage. Pending and sold events may relate to listings that entered the market earlier.
For background on the separate First Look category, see Team NSRG’s First Look explainer.
September 2026 manufactured home context
InfoSparks labels this monthly property category Manufactured. The figures below use its Lynnwood City area, all styles and prices, for September 2026. Land ownership and park-only coverage were not independently established. The small number of closed sales is important context for every average.
September 2026 metric | Value |
|---|---|
Average days on market | 67 days |
Months of supply based on closed sales | 7.5 months |
Average sale price as a percent of original list price | 78.2% |
Closed sales | 5 |
Average sold price | $71,900 |
Only five sales closed in September, the same number as August. That is a very small sample. Average days on market was 67, compared with 60 in August, while months of supply moved from 8.3 to 7.5. The average price and original-list-price ratio can be heavily affected by which homes happened to sell.
Changes in the average sale price can reflect the mix of homes sold. They do not establish that an individual home’s value changed by the same amount, and the original-list-price ratio is not a promised discount on a current listing.
A closer look at Lynnwood manufactured home activity
No pending events were recorded in this view, even though there were three sold events. Those categories occur at different stages of a transaction. A home can close after going under contract in an earlier period, so the figures don’t tell us that current demand has disappeared.
The reduction and increase show asking prices moving in both directions on individual listings. The snapshot does not provide the dollar amounts, ownership arrangements or property conditions needed to explain those changes.
What buyers can take from this
Before comparing prices, confirm whether the purchase includes land and what ongoing costs apply. Where a home is in a community, review its applicable rules and fees. Have a lender evaluate the particular home and purchase arrangement rather than relying on a general payment estimate.
What sellers can take from this
Compare your home with properties that share its ownership arrangement, condition and ongoing costs. Three sold events are useful starting points for research, but the event count alone won’t establish an asking price for your home.
Frequently asked questions
How many Lynnwood manufactured home sales were recorded?
The exact Manufactured Homes subtype search recorded three Listing Sold events in the seven-day view retrieved October 12, 2026.
Does this report include only homes in parks?
That scope has not been independently established. The report follows the NWMLS Manufactured Homes subtype exactly. Confirm the land ownership or lease arrangement for each property.
Does zero pending activity mean there are no buyers?
No. It means this filtered seven-day view recorded zero Listing Pending events. It does not measure all buyer interest or all properties already under contract.
If you’re comparing manufactured homes in Lynnwood, Team NSRG can help you sort through the listing details and ownership arrangements.
[email protected] | 206-349-9748
Jeremy Minor | Team NSRG
Sources and scope
Source: Northwest Multiple Listing Service member Market Watch, 7 Day view, retrieved October 12, 2026 at 15:32:00 UTC. The query lower bound is October 5, 2026 and the snapshot includes activity through retrieval on October 12. This is not a completed October 5 through 11 calendar week. The query boundary time zone was not displayed. All prices are included; data may change as records are updated.
Search scope: exact NWMLS Manufactured Homes subtype. Manufactured styles classified under Residential were not added. The park-versus-owned-land coverage was not independently established. Geography uses the NWMLS City field.
Monthly source: NWMLS InfoSparks, September 2026 monthly view, retrieved October 12, 2026. Manufactured category, all styles and prices, InfoSparks City area. Park-only or owned-land-only coverage was not verified. Average days on market measures listing to offer acceptance. Months of supply uses month-end inventory divided by average monthly closed sales over the preceding 12 months. Average percent of original list price uses the listing ID, excludes concessions and can reset after relisting. Closed-sales totals are not guaranteed to be the sample size for every other metric.
Market Watch source: NWMLS member portal (member sign-in required). InfoSparks source (member access may be required). Data is deemed reliable but not guaranteed. Verify current listing information before acting.