

October 18, 2026 · Jeremy Minor, Team NSRG
More homes to choose from and more time on the market are giving Snohomish buyers a different picture than a year ago. For sellers, that makes a thoughtful asking price and a well-prepared home especially important. Prices tell a mixed story: September’s median sale price was higher than a year earlier, but slightly lower than August. Here’s what that means if you’re thinking about a move in the City of Snohomish.
What this means for your next move
Buying? Use the wider selection to compare location, condition and price. Look at recent nearby sales as well as the homes you could buy today. More choice is useful, but it does not mean every seller will negotiate.
Selling? Make it easy for buyers to see how your home compares with the alternatives. Start with nearby sales and competing listings, then pay attention to showing feedback. The citywide median is useful context, not a price tag for your home.
A snapshot of this week’s activity
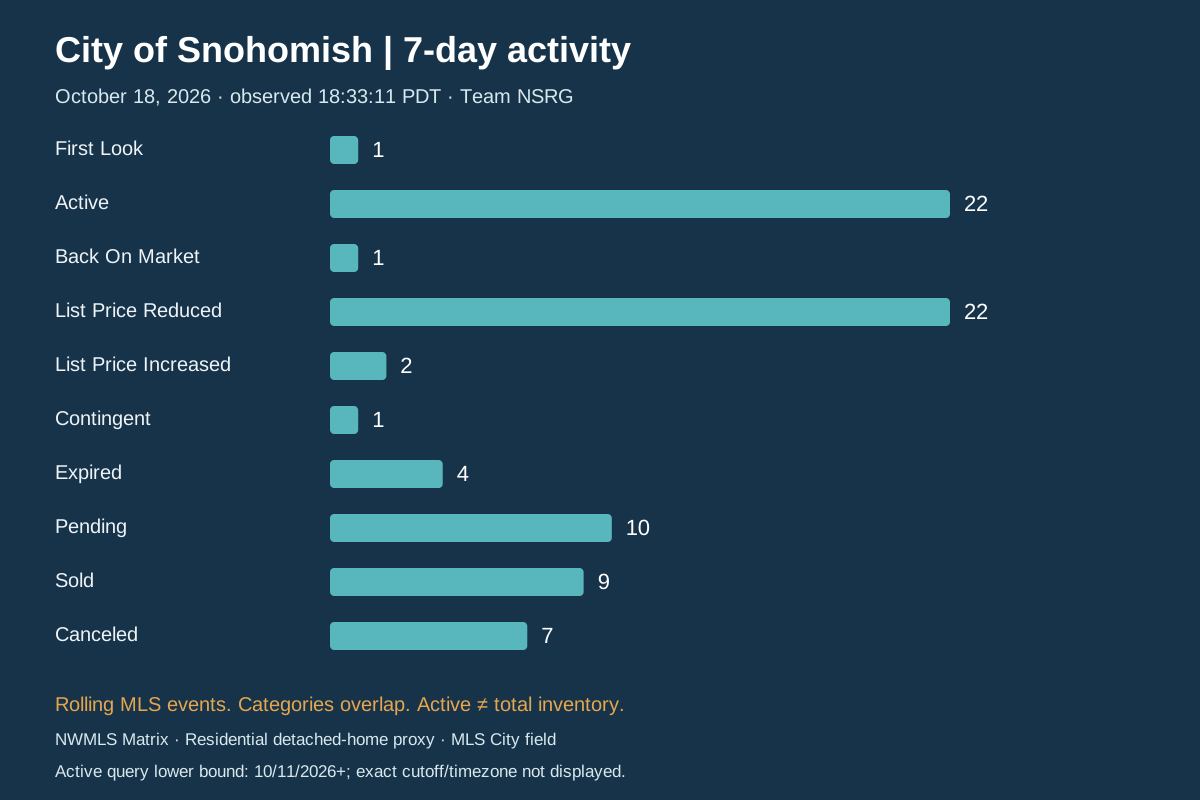
Price reductions stood out alongside new activity in the seven-day Market Watch view. The chart shows how those events compare. These categories can overlap, so they are not a count of unique homes or evidence of a lasting trend on their own.
The bigger picture: September 2026
Compared with a year earlier, more homes were for sale and typical selling times were longer. Yet the median sale price remained above last September. That is a reason to look closely at the homes in your price range, rather than assume prices are falling everywhere.
The longer price history below helps put one month in perspective. The dashed line smooths month-to-month changes; it is not a forecast. These monthly figures cover the broader Residential market, while the weekly activity uses a detached-home proxy.

Click Below to View Listings
New Active listings on Team NSRG
Want to talk through what these numbers mean for a home or neighborhood you have in mind? Contact Jeremy Minor and Team NSRG. I’m happy to help you compare your options.
A closer look at the numbers
If you like to dig into the details, the full figures are below.
Seven-day activity counts
Market Watch event | Count |
|---|---|
First Look | 1 |
Active | 22 |
Back On Market | 1 |
List Price Reduced | 22 |
List Price Increased | 2 |
Contingent | 1 |
Expired | 4 |
Pending | 10 |
Sold | 9 |
Canceled | 7 |
September compared with August and a year earlier
Residential metric | August 2026 | September 2026 | MoM | YoY |
|---|---|---|---|---|
Median sales price | $949,000 | $940,000 | -0.9% | +1.6% |
Closed sales | 62 | 59 | -4.8% | -25.3% |
Homes for sale | 226 | 235 | +4.0% | +34.3% |
Median days on market | 22 | 28 | +27.3% | +47.4% |
Months supply (closed) | 3.4 | 3.6 | +5.9% | +63.6% |
Sources and scope
Weekly source: NWMLS Matrix Market Watch, "7 Day," observed October 18, 2026 at 18:33:11 PDT. The Active results showed a lower bound of 10/11/2026+. The exact cutoff time and source-query timezone were not displayed; other event-specific query boundaries were not individually inspected. This is a rolling view through retrieval, not a verified exact 168-hour interval or a completed October 11-17 calendar week.
Weekly filters: Washington, Snohomish County, MLS City field Snohomish; Residential; style codes 10-18, 25 and 26; Building Information excluding Attached/Zero Lot Line; status excluding Incomplete; all prices; no map selected. This is an MLS-coded detached-home proxy, not physical verification or an independently mapped municipal boundary. Events may overlap and should not be added into unique-home inventory or net changes. "Active" is the Market Watch event label, not total active inventory.
Monthly source: NWMLS InfoSparks, City of Snohomish (source area label: “Snohomish City”), Residential, Monthly, September 2026; all other filters unrestricted. Monthly collection occurred October 18, 2026, approximately 22:49-22:51 PDT. This broader Residential series is not detached-only and is not directly comparable to the weekly event counts. YoY is the displayed source comparison with September 2025; MoM is calculated from the displayed August and September values and rounded to one decimal. Days on market is the median; supply uses the Closed measure. Statistics may be revised by the source. The external Redfin live search may include nearby areas and other property types and does not match the dated First Look count. Not all First Look listings are publicly visible; sellers control IDX publication. The Active link is a live search for listings with seven or fewer days on market and does not reproduce the dated activity counts. The linked website search uses its Residential category and city search area; it is not independently verified as detached-only or as an exact municipal boundary. The median-price graph covers January 2023–September 2026; its price axis does not start at zero. The dashed orange three-month moving average is the arithmetic mean of the current and previous two monthly medians, beginning March 2023. It smooths monthly variation and is not a forecast or a pooled three-month median. Exact monthly prices were read from the authenticated InfoSparks chart tooltips on October 19, 2026, using the same city and Residential filters.
[1] First Look Listings links to Redfin, which labels this broader search Coming Soon / Early Access. Results may include other statuses, property types and nearby areas and are not an exact match to NWMLS First Look counts. Not every result is a First Look listing.