
So, what has happened with detached single-family homes in Auburn over the last seven days? Here are the vital stats, straight from the Market Watch widget available to members of the Northwest Multiple Listing Service (NWMLS).
Auburn detached-home activity over the last seven days
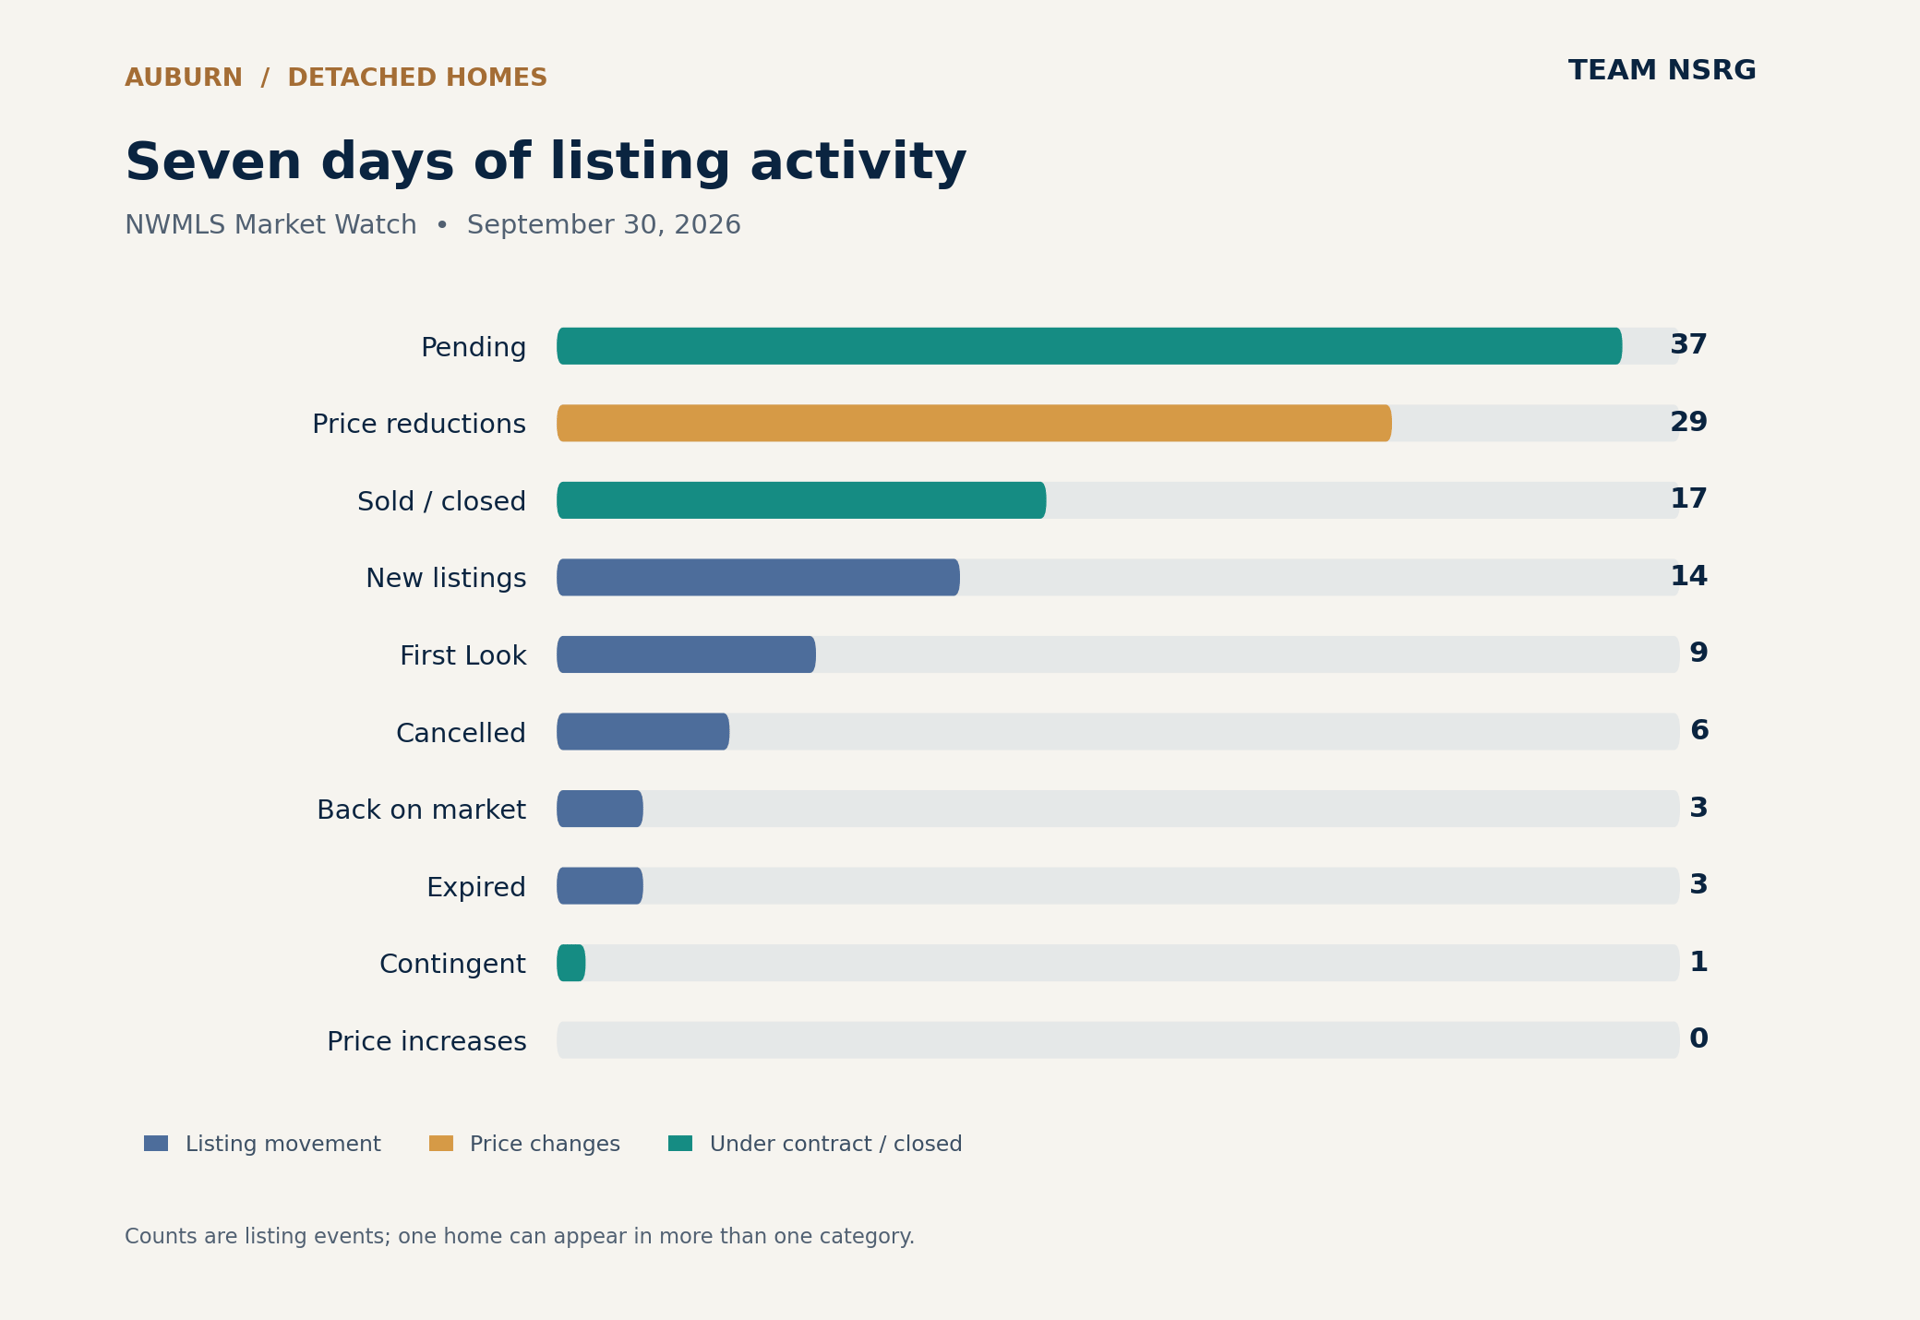
The chart shows each category separately. A home may appear in more than one category during the same week.
Listing activity | Count |
|---|---|
First Look listings | 9 |
New listings | 14 |
Back on market after going pending | 3 |
Listing price reductions | 29 |
List price increases | 0 |
Contingent on the buyer selling a home | 1 |
Expired listings | 3 |
Pending sales | 37 |
Sold and closed | 17 |
Cancelled listings | 6 |
First Look is a newer NWMLS listing status. Read my explanation of First Look if you want to know what it means for buyers and sellers.
Did Auburn inventory just top out?
Here is the way I read this week. There were 64 events across First Look, new listings, homes returning to market, price reductions, expirations and cancellations. On the other side, 55 listings went contingent, pending or sold. That is a lot of buyer activity, especially with rates where they are.
Those 64 events do not represent 64 different homes. A home can show up in more than one category during a seven-day window, and a price reduction does not add a home to inventory. Still, seeing 37 pending sales and 17 closings makes me wonder whether Auburn's inventory may be nearing a peak. We will need the next inventory reading to know for sure. If it has topped out, that would be a good thing given the other pressures on this market.
In the monthly resale figures I am tracking, months of supply reached 4.0 in August, up from 1.4 in January. That is a major change in the amount of choice available to buyers. My historical comparison puts the last reading over four months back in October 2012. The seven-day Market Watch activity above and these monthly inventory figures are different measures, so I would not use one week alone to call a turn.
Mortgage rates are adding pressure
The mortgage rate environment keeps getting tougher. Mortgage News Daily's latest available national daily index, dated September 29, put the top-tier 30-year fixed rate at 7.58%. Back in late February, its index briefly dipped below 6%. That is a big change for a buyer trying to qualify for the same home today.
The Federal Reserve raised its federal funds target range by a quarter point at its September meeting, while longer-term Treasury yields have also been elevated. Mortgage rates are more closely tied to longer-term bond markets than to the Fed's overnight policy rate. For the consumer, the practical result is familiar: financing costs hurt.
If borrowing costs remain this high, I expect price reductions to remain part of the Auburn market. We already saw 29 of them in this seven-day snapshot.
What this means for Auburn buyers and sellers
For buyers who can make the financing work, the world is their oyster. More choice and more price reductions can create room to negotiate on price, closing costs or a seller-funded rate buydown. The right opportunity still depends on the home's condition, asking price and how long it has been on the market. There are no automatic discounts.
For sellers, it is worth paying close attention to the homes going pending, not just the ones cutting their prices. Buyers are still acting. The question is which homes are earning that attention, and at what price.
Anyhow, if you are buying or selling a detached home in Auburn, Team NSRG is happy to help you look at the numbers for your neighborhood and price range.
— Jeremy Minor, Team NSRG
Sources and scope
- Seven-day Auburn detached single-family listing activity: NWMLS Market Watch widget, figures supplied for this September 30, 2026 update. Categories describe listing events and can overlap.
- 30-year fixed mortgage rate: Mortgage News Daily national daily index, latest available reading September 29, 2026; late-February sub-6% reading.
- Federal funds target range: Federal Reserve statement, September 16, 2026.
- January and August months-of-supply figures and October 2012 comparison: Jeremy Minor's supplied monthly market analysis.