Team NSRG | October 26, 2026 | By Jeremy Minor

Tacoma buyers are still making moves, while sellers continue to adjust prices. My read is that buyers have room to compare options, but well-positioned homes can still attract interest. September's broader Residential figures add context: more homes were for sale than a year ago, even as fewer sales closed.
What Buyers And Sellers Can Take From This
For buyers: Compare the available homes carefully and keep condition, location and your payment in view. A price reduction is a reason to take another look, not proof that a home is underpriced.
For sellers: Make your asking price easy to justify against nearby alternatives. Preparation and a clear value proposition can help your home compete in a market with more selection.
The Latest Seven-Day View
The latest report recorded 95 pending events and 44 sold events, compared with 86 and 44 in our October 19 report. Price reductions fell from 93 to 73 and Active events from 53 to 50. Buyers are still moving in these snapshots, while substantial price-cut activity continues.
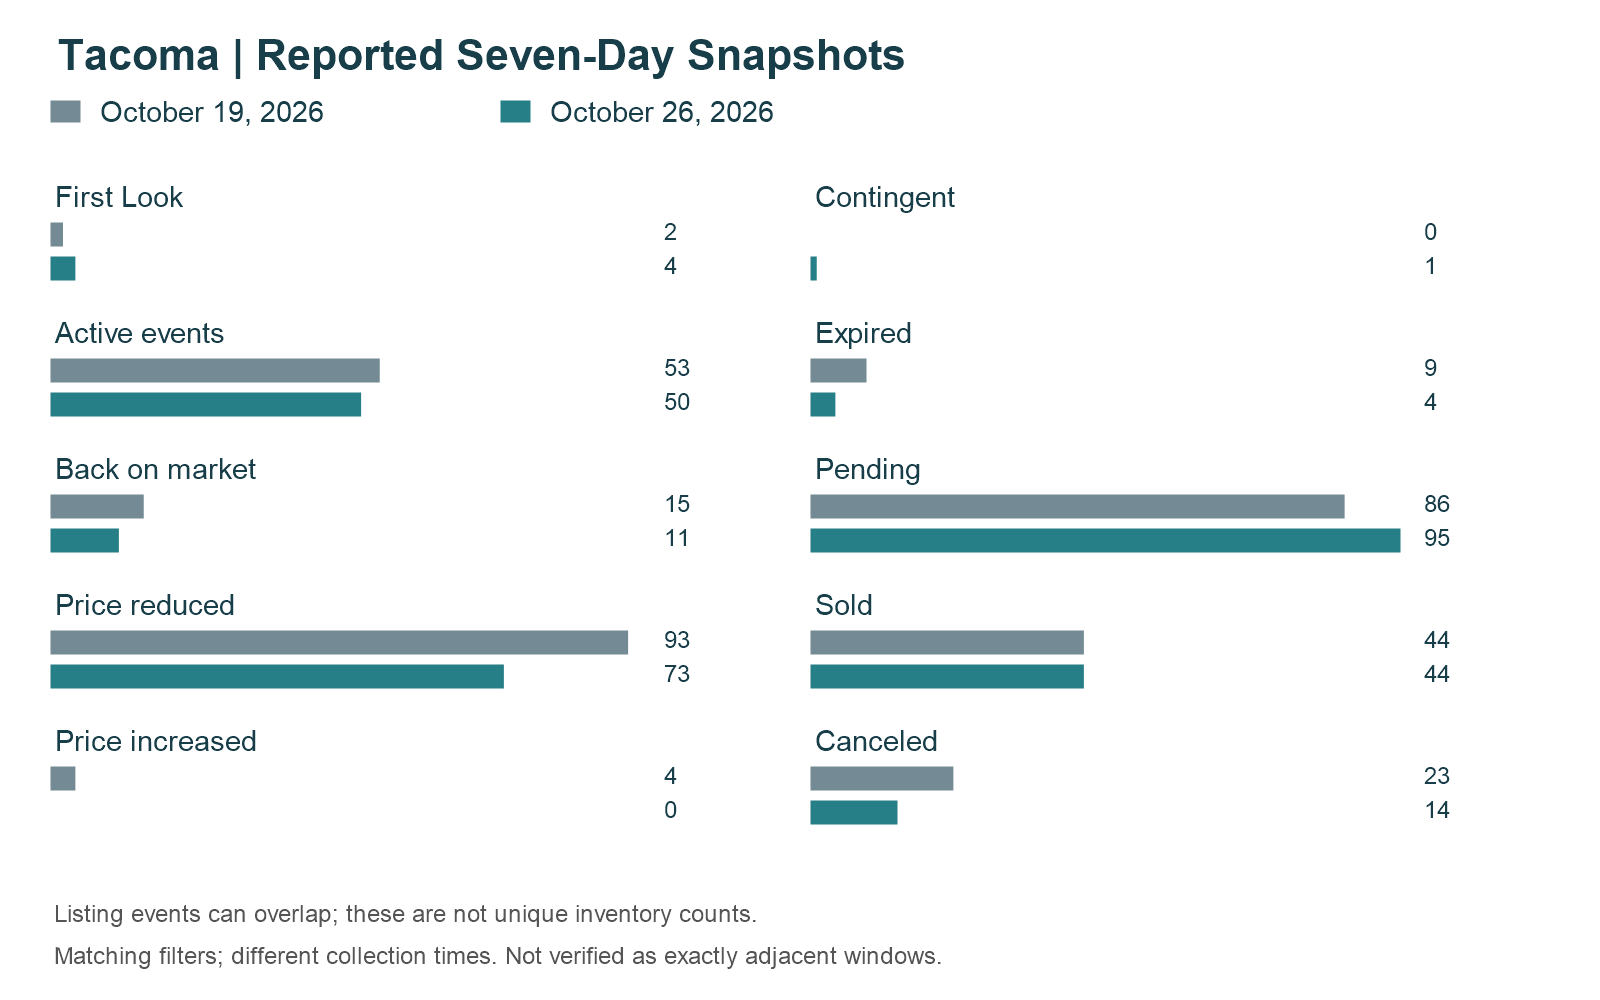
October 19 and October 26 are saved report snapshots collected at different times. This is a previous-report comparison, not a verified comparison of adjacent seven-day periods. Listing-status events overlap and are not unique inventory counts.
September Context For Your Decision
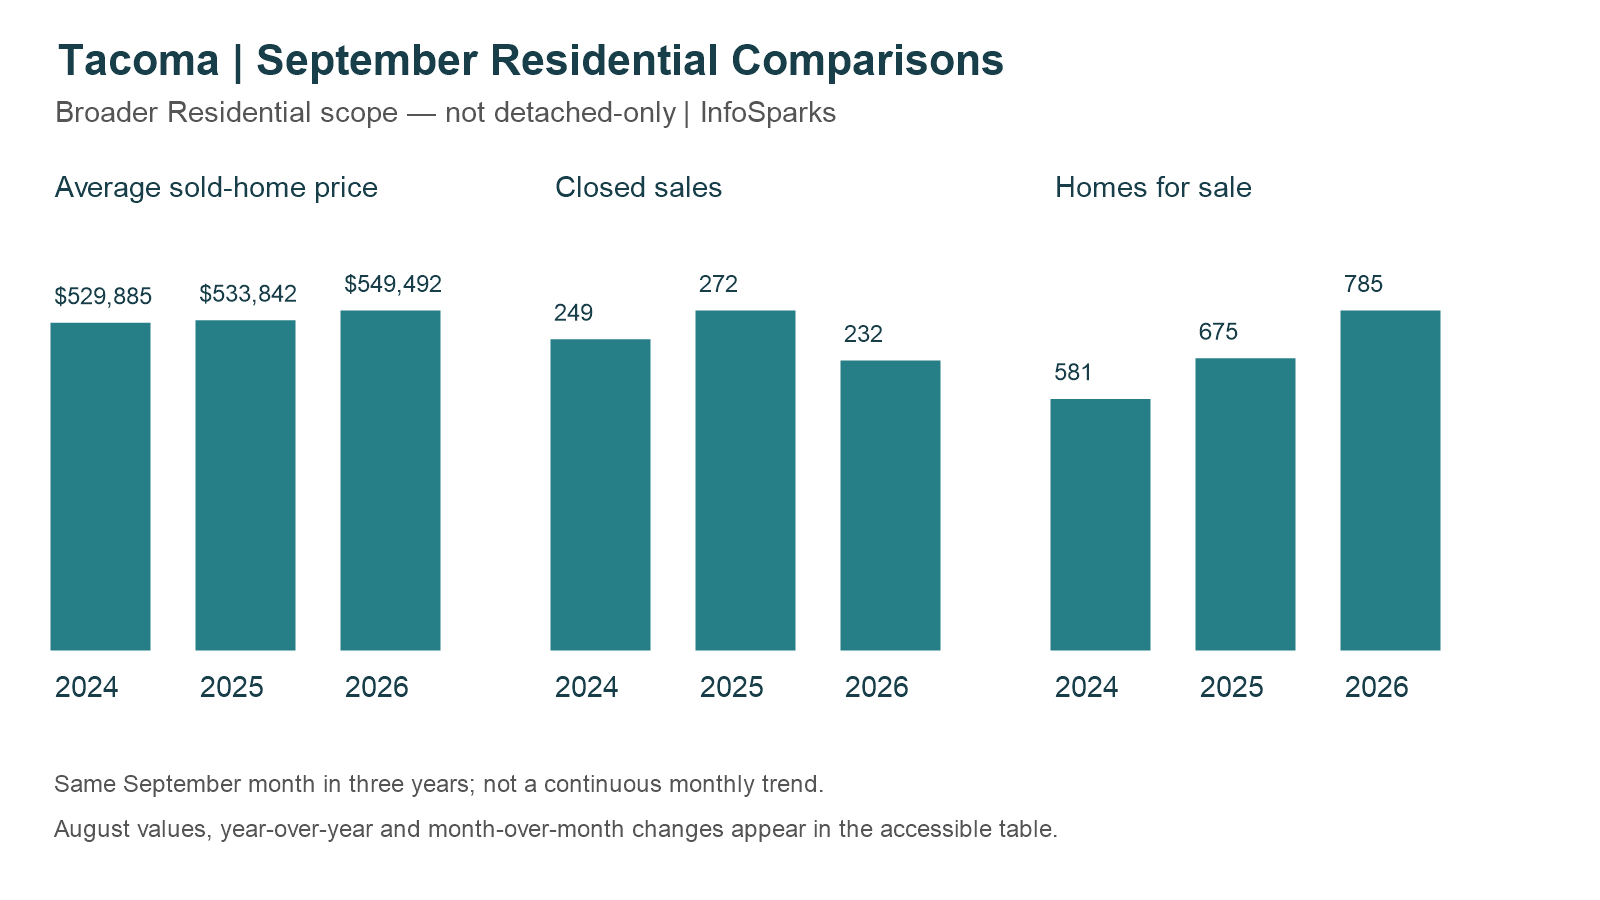
September's broader Residential homes for sale rose 16.3% from a year earlier, while closed sales fell 14.7%. Average sold-home price was 2.9% higher year over year and 1.6% above August. That is not a uniform softening story: selection increased, closings slowed, and the average price of the homes that sold increased. The mix of sales matters.
Monthly figures cover broader Residential homes, not detached-only. Average prices reflect the mix of homes sold and do not measure individual-home appreciation.
Rates And Your Monthly Payment
The national 30-year fixed weekly survey averaged 6.67% in August and 6.86% in September. Price is only one part of affordability: compare the payment for the home and financing available to you. These national series do not establish why local prices changed.
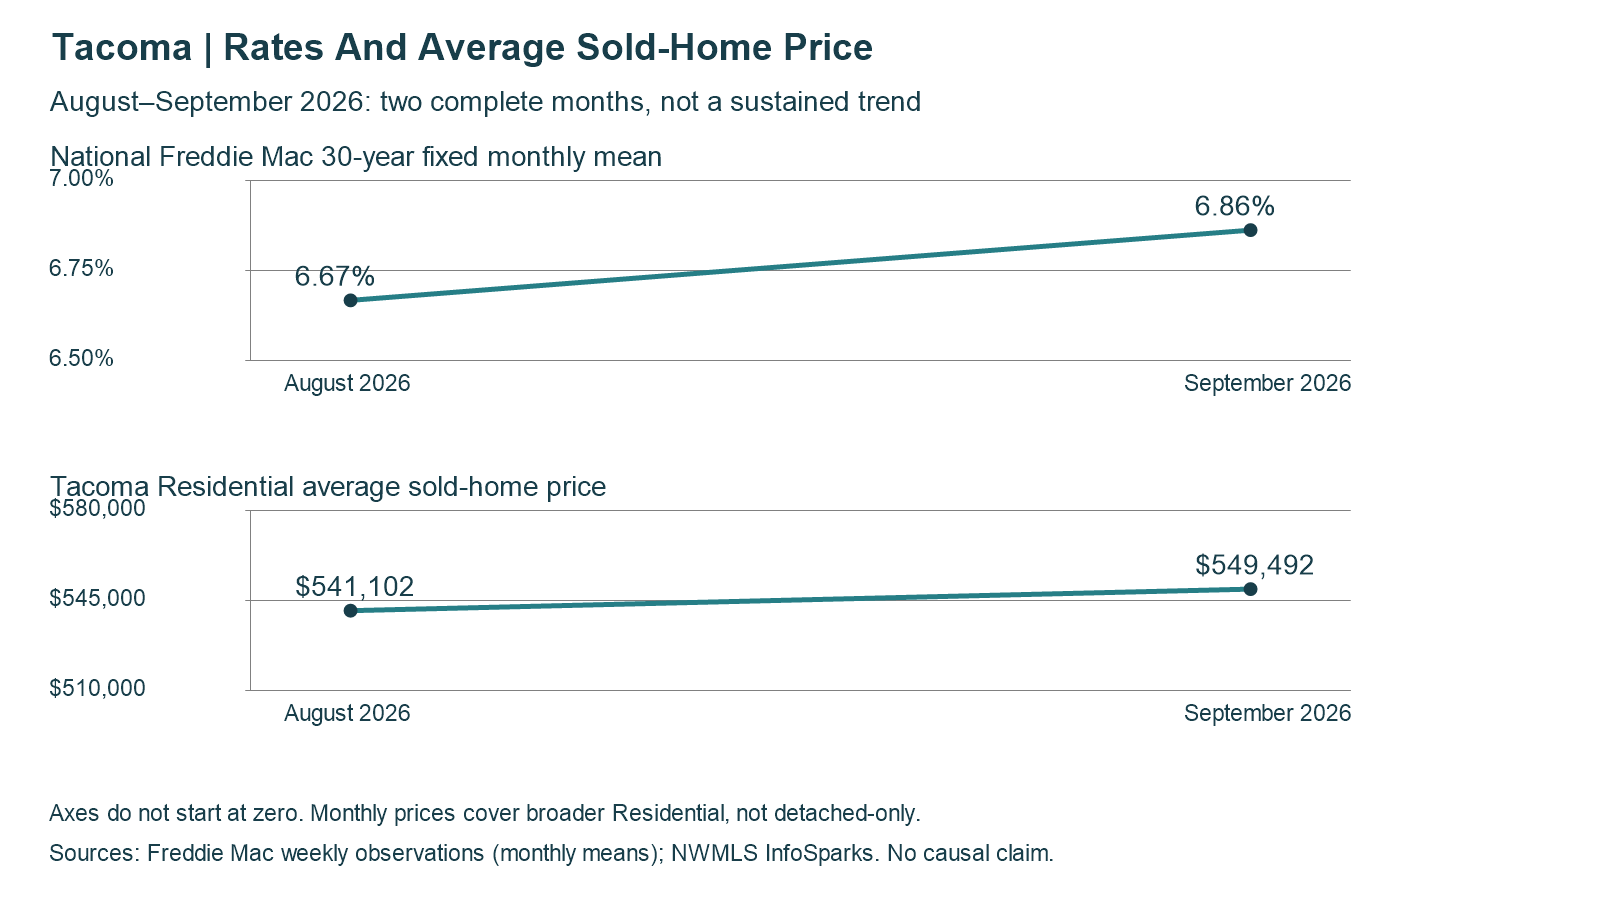
Two complete months, not a sustained trend. Rates are arithmetic means of Freddie Mac weekly observations, not a downloaded monthly FRED export. The price series covers broader Residential homes.
Mortgage-Rate Snapshot: October 23, 2026
The latest dated Mortgage News Daily observation checked for this report was October 23. These national index readings are context, not a lender quote or live widget. MND's daily index differs from Freddie Mac's weekly survey; the two methods and their rates are not interchangeable.
Loan type | Rate | Daily change (percentage points) |
|---|---|---|
30-year fixed | 7.33% | +0.03 |
15-year fixed | 6.98% | +0.02 |
30-year jumbo | 7.60% | 0.00 |
7/6 SOFR ARM | 6.75% | -0.03 |
30-year FHA | 6.98% | +0.06 |
30-year VA | 6.99% | +0.05 |
Current MND rate page | Daily rate movement and methodology
The Numbers Behind The Update
Listing event | October 19 report | October 26 report | Change | Change % |
|---|---|---|---|---|
First Look | 2 | 4 | +2 | +100.0% |
Active events | 53 | 50 | -3 | -5.7% |
Back on market | 15 | 11 | -4 | -26.7% |
Price reduced | 93 | 73 | -20 | -21.5% |
Price increased | 4 | 0 | -4 | -100.0% |
Contingent | 0 | 1 | +1 | Not defined (prior 0) |
Expired | 9 | 4 | -5 | -55.6% |
Pending | 86 | 95 | +9 | +10.5% |
Sold | 44 | 44 | +0 | +0.0% |
Canceled | 23 | 14 | -9 | -39.1% |
Period | Average sold-home price |
|---|---|
September 2024 | $529,885 |
September 2025 | $533,842 |
August 2026 | $541,102 |
September 2026 | $549,492 |
Year over year | +2.9% |
Month over month | +1.6% |
Period | Closed sales |
|---|---|
September 2024 | 249 |
September 2025 | 272 |
August 2026 | 238 |
September 2026 | 232 |
Year over year | -14.7% |
Month over month | -2.5% |
Period | Homes for sale |
|---|---|
September 2024 | 581 |
September 2025 | 675 |
August 2026 | 787 |
September 2026 | 785 |
Year over year | +16.3% |
Month over month | -0.3% |
Month | National 30-year fixed mean |
|---|---|
August 2026 | 6.6675% |
September 2026 | 6.8625% |
Month | Average sold-home price |
|---|---|
August 2026 | $541,102 |
September 2026 | $549,492 |
Click Below To View Listings
Active-Event Listings
These properties matched the dated Active-event source snapshot. Events can include status transitions; they are not necessarily first-ever listings or a guarantee of current Active status.
4305 40th Avenue NE | MLS 2597973
3813 N Mullen Street | MLS 2598075
4114 58th Street Ct E | MLS 2597634
9001 9th Avenue E | MLS 2598045
3704 N Tyler Street | MLS 2597914
7225 S Bell Street | MLS 2590844
1515 141st Street E Unit 72 | MLS 2597851
4706 Silver Bow Road NE | MLS 2597551
3561 S Gunnison Street | MLS 2597207
1417 138th Street E Unit 136 | MLS 2597734
6323 N Hale Street | MLS 2595869
1319 N Cedar Street | MLS 2597117
7802 S Asotin Street | MLS 2596474
3331 S Alaska St | MLS 2597461
5209 Varco Road NE | MLS 2597044
828 E 68th Street | MLS 2596764
8022 McKinley Avenue | MLS 2589662
303 105th Street E | MLS 2597567
407 S Wright Avenue | MLS 2595828
1911 S Hosmer Street | MLS 2597264
6224 S Prospect Street | MLS 2597421
5918 S Cheyenne Street | MLS 2597269
14517 4th Avenue Ct E | MLS 2597499
2053 N Fremont Street | MLS 2597352
703 117th Street S | MLS 2597054
15221 50TH Avenue E | MLS 2595863
1014 E 56th Street | MLS 2596127
9832 Patterson Street S | MLS 2597329
4041 S Bell Street | MLS 2596881
2515 167th Street Ct E | MLS 2597004
1309 S 92nd Street | MLS 2596869
3790 E B Street E | MLS 2596876
2401 S 72nd Street | MLS 2597290
3111 S 14th Street | MLS 2590538
1677 S 51st Street | MLS 2596357
3855 Tacoma Avenue S | MLS 2591570
4624 N Huson Street | MLS 2595908
7424 Fawcett Avenue | MLS 2593647
1224 130th Street E | MLS 2597020
4205 N 9th Street | MLS 2596722
5031 N Bristol Street | MLS 2592717
701 E 68th Street | MLS 2594764
4052 E Spokane Street | MLS 2596692
709 137th Street S | MLS 2593444
1207 Violet Meadow Street S | MLS 2595400
3424 N 30th Street | MLS 2594790
11251 Park Avenue S | MLS 2595858
First Look Listings
These records matched the dated NWMLS First Look snapshot. Public status can change.
5415 21st Av Ct NE | MLS 2597423
1319 60th Ave NE | MLS 2596837
Questions Buyers And Sellers Ask
Does the average price tell me what my home is worth?
No. It describes the mix of homes that sold. Recent comparable sales, current competition, condition and location provide a more useful starting point for an individual home.
Do these weekly counts equal the number of homes available?
No. They count listing-status events in the source view, and a listing can appear in more than one category. Monthly homes-for-sale figures are a separate, broader Residential measure.
Making Your Next Move
Tacoma's opportunity is to make an informed move rather than rely on a single headline. Buyers can compare more alternatives; sellers can compete by getting price and presentation right. If you are considering buying or selling, I am happy to help you put the relevant homes and numbers in context. - Jeremy
Sources And Scope
NWMLS Matrix Market Watch, 7 Day Single Family view, collected 2026-10-26T15:24:04.332Z (Pacific local time 8:24:04 a.m. on October 26). Washington; Pierce County; MLS City Tacoma; Residential styles 10–18, 25 and 26; excludes Attached/Zero Lot Line and Incomplete; all prices; no map. This is the established detached-home proxy, not an independent structural or municipal-boundary audit. Active and First Look queries displayed modification timestamps October 19, 2026 onward. Exact upper cutoff and source timezone were not displayed; the other event categories were not individually boundary-verified. Prior October 19 report displayed October 12 onward in inspected queries, with exact cutoff/timezone unrecorded. Counts therefore compare reports, not verified adjacent 168-hour windows.
Monthly: authenticated NWMLS InfoSparks, Tacoma, Residential, other filters unrestricted, Monthly, retrieved October 26, 2026. Monthly statistics reflect the October 26, 2026 retrieval and may be revised. September is the latest complete month; August supplies the month-over-month comparison. Freddie Mac weekly archive and FRED MORTGAGE30US definition: August weekly rates 6.69, 6.67, 6.65, 6.66%; September 6.71, 6.76, 6.95, 7.03%. National rates are not city-specific. MND October 23 dated observation was checked October 26.