
Historical report: October 21, 2026. Prepared from the retained source collection for that date; published November 2, 2026. Listing availability and mortgage rates may since have changed.

When you find a Shoreline home that fits your plans, I’d look closely at its condition, its competition and what the seller hopes to accomplish. A price adjustment can open a conversation, but the terms still need to make sense for you. If you’re selling, thoughtful pricing and preparation can give buyers a clear reason to choose your home.
For buyers: Revisit a price reduction when the home meets your needs, and compare its condition and monthly cost with similar alternatives. A change in asking price is a reason to take another look, not a guarantee that it is the best value.
For sellers: The pending activity shows that buyers are willing to move forward. Focus on a price supported by nearby sales, clear presentation and easy showings. Use feedback from your own home and its closest competition when deciding whether to adjust.
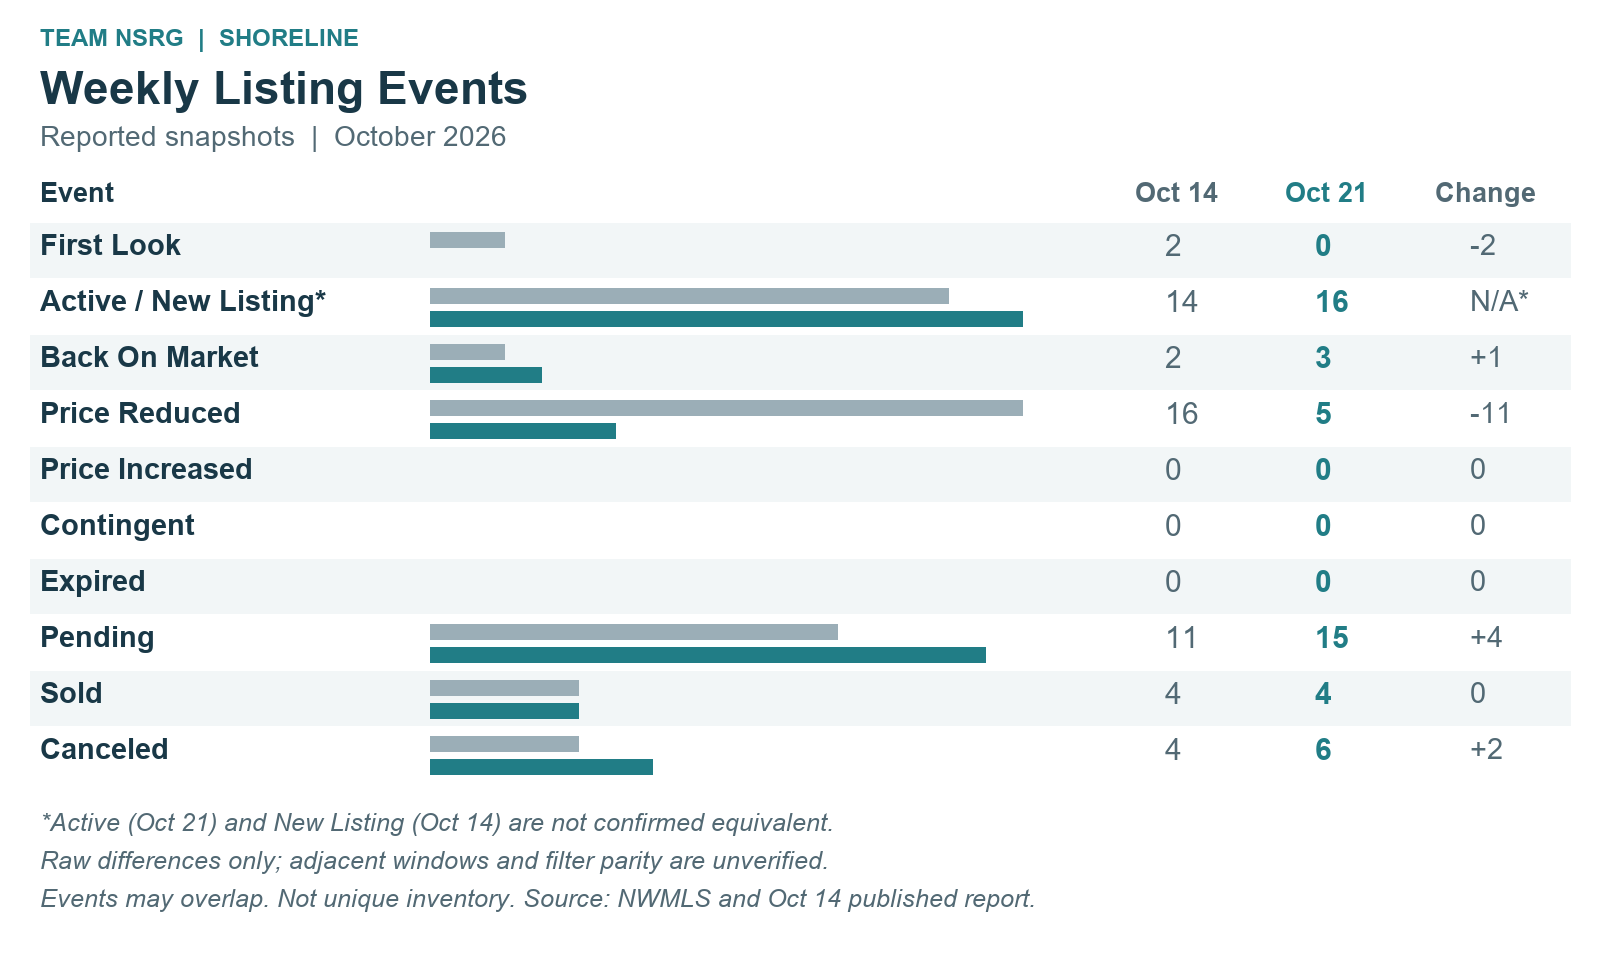
October 21 Listing-Event Snapshot
NWMLS Matrix 7 Day view, captured October 21 at 10:39 a.m. Pacific. The graphic includes the previous published report for context.
Open full-size weekly chart · Open larger-label mobile chart
A pending event shows that a buyer moved forward; it does not tell us how quickly the whole market is moving. I’d use the snapshot to guide questions about individual homes, rather than draw a forecast from a short reporting period.
September Prices In Context
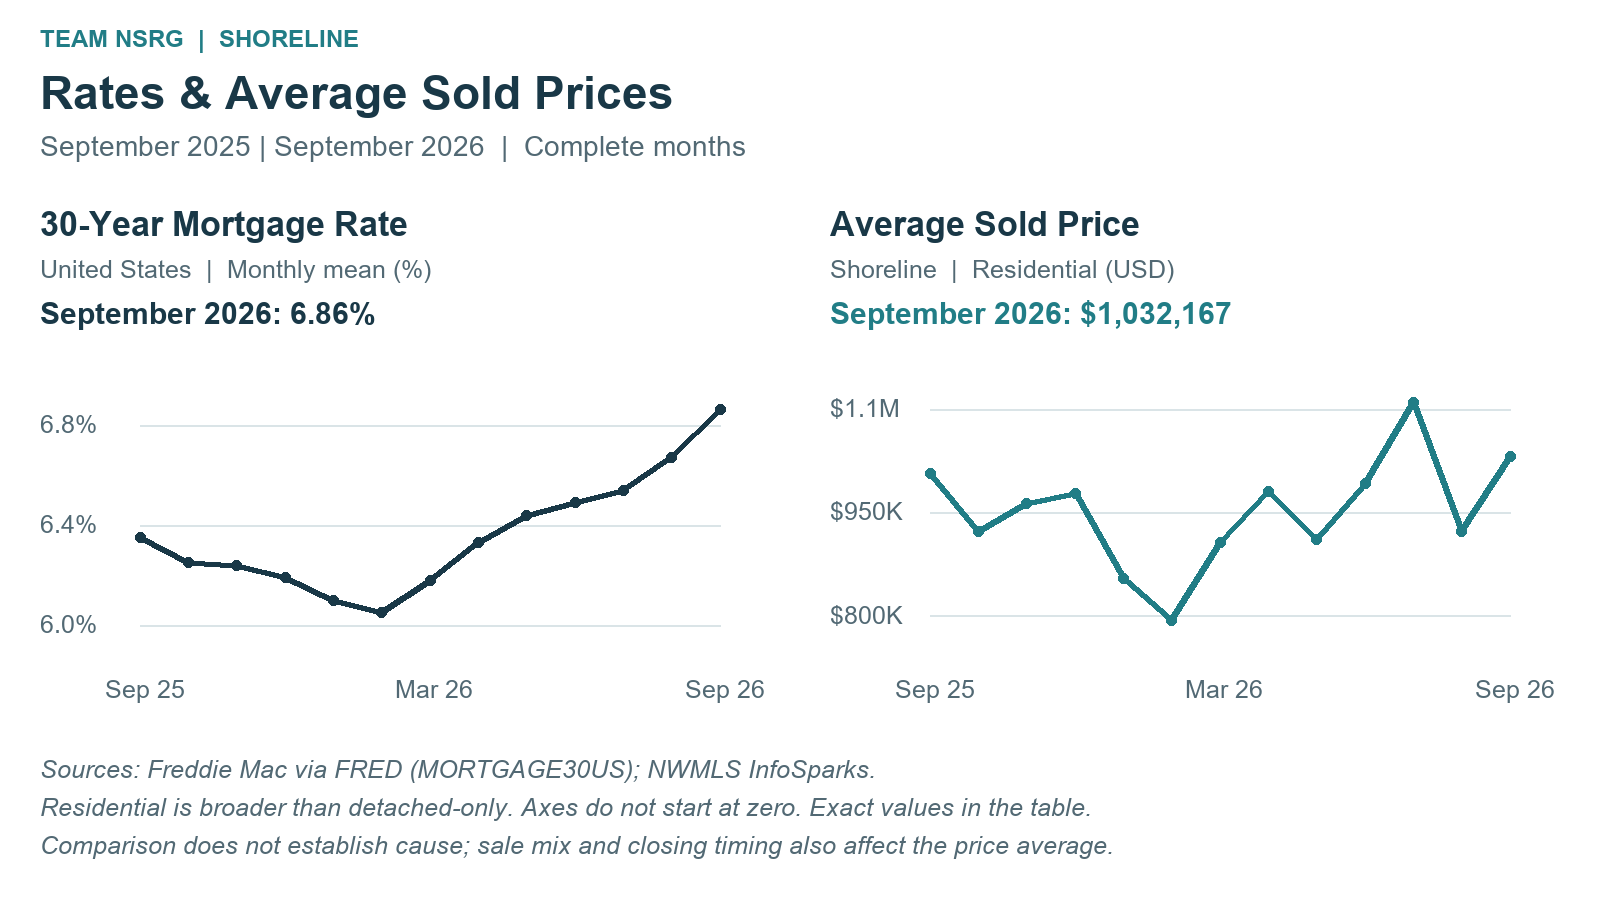
September’s higher average sold price is useful background, though the mix of homes that closed matters. I’d start with recent sales of similar homes when thinking about an asking price or an offer. The chart and tables below retain the exact broader Residential averages and comparisons.
An average changes with the mix of homes that sell. This increase does not mean every Shoreline home gained the same amount. For a specific home, recent sales with similar size, condition and location are more useful than the citywide average alone.
Mortgage Rates And Home Sale Prices
It helps to work through the payment with your lender before settling on an offer price. The historical national rate series provides context; it isn’t a quote for your loan or a city-specific rate.
The two panels show rates and Shoreline average sold prices over the same complete months. Their movement does not establish cause: sale mix and closing timing also affect the price average.
Open the full-size desktop chart · Open the larger-label mobile chart
Mortgage-Rate Snapshot: October 21, 2026
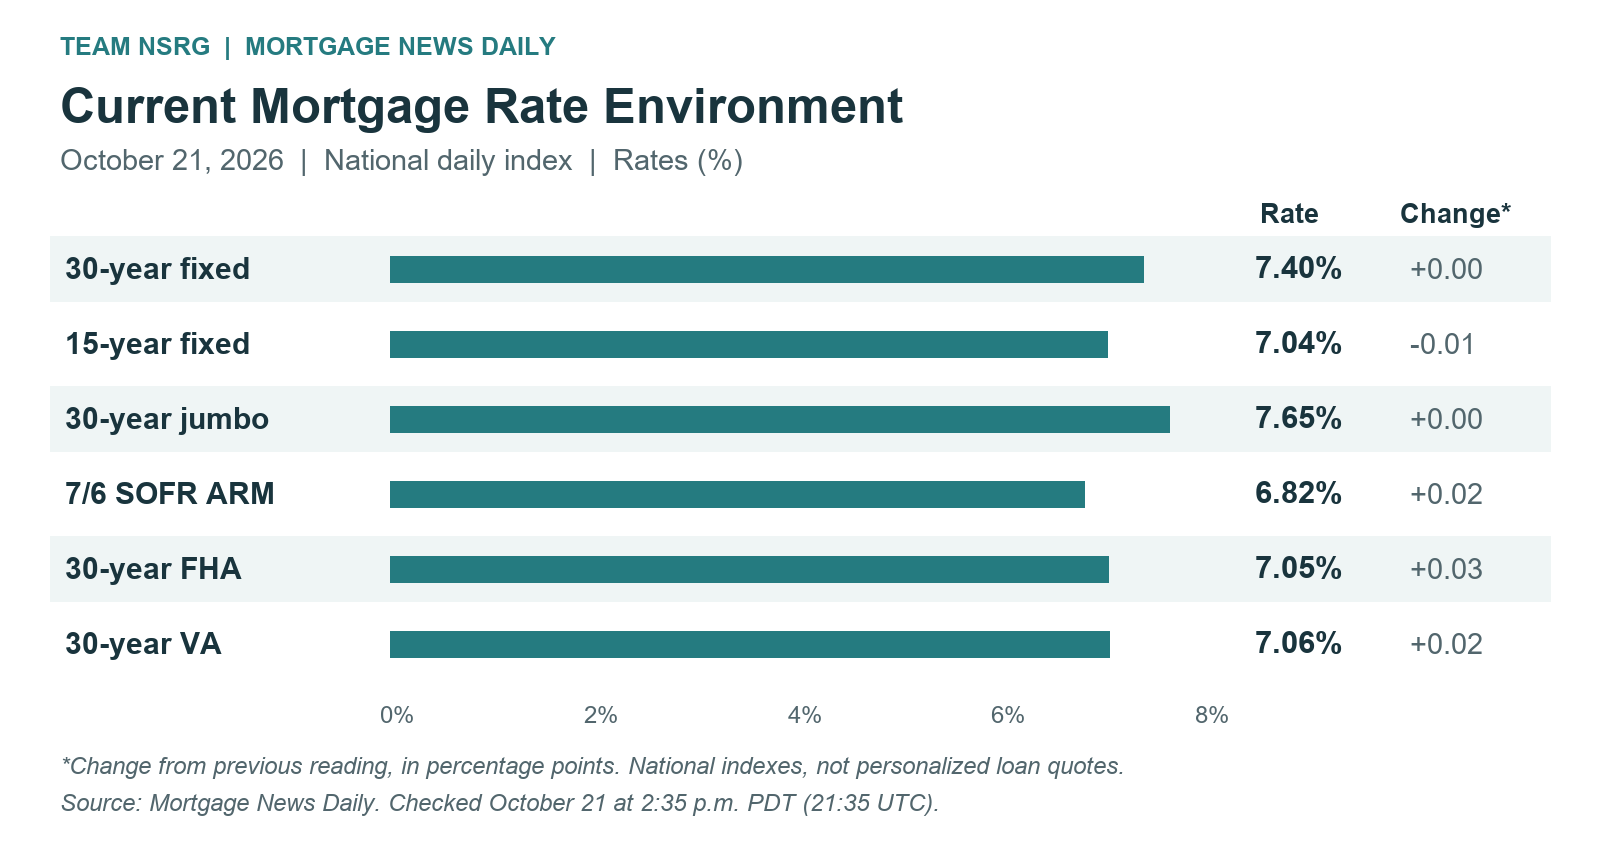
Mortgage News Daily’s October 21 national daily index ended at 7.40% for a 30-year fixed mortgage, unchanged from the previous reading, after an earlier dip. This daily snapshot is separate from the monthly FRED averages above. Compare the full payment and loan terms with your lender; these indexes are not personalized loan quotes.
Open full-size current-rate graph · Live mortgage-rate dashboard · MND daily index
Loan product | Rate | Change (pp) |
|---|---|---|
30-year fixed | 7.40% | 0.00 |
15-year fixed | 7.04% | -0.01 |
30-year jumbo | 7.65% | 0.00 |
7/6 SOFR ARM | 6.82% | +0.02 |
30-year FHA | 7.05% | +0.03 |
30-year VA | 7.06% | +0.02 |
Source: Mortgage News Daily, October 21, 2026 daily index; checked at 2:35 p.m. PDT (21:35 UTC). Changes are percentage points from the previous reading. National rate indexes differ from APRs, lender offers and the monthly FRED series. Read the day’s rate commentary.
Click Below to View Listings
View Shoreline's 16 Seven-Day Active Event Listings
This OneHome link contains the verified 16-listing selection from the October 21 query. It is a saved selection, not a rolling search; availability can change. The source snapshot recorded zero First Look listings, so there is no First Look listing set to link.
Detailed Data And Comparisons
Weekly reported snapshots
Listing event | Oct 14 report | Oct 21 snapshot | Raw difference |
|---|---|---|---|
First Look | 2 | 0 | -2 |
Active / New Listing* | 14 | 16 | Not comparable |
Back On Market | 2 | 3 | +1 |
Price Reduced | 16 | 5 | -11 |
Price Increased | 0 | 0 | 0 |
Contingent | 0 | 0 | 0 |
Expired | 0 | 0 | 0 |
Pending | 11 | 15 | +4 |
Sold | 4 | 4 | 0 |
Canceled | 4 | 6 | +2 |
These are reported-snapshot differences, not a validated week-over-week comparison. Active and New Listing have not been established as equivalent, so no difference is calculated for that row. A comparable week-over-week percentage is unavailable for every row because exact adjacent windows and filter parity are unconfirmed. Zero counts are retained as zero, not treated as missing data.
Average sold price: broader Residential
Comparison | Dollar change | Percent change |
|---|---|---|
August 2026 to September 2026 | +$109,709 | +11.9% |
September 2025 to September 2026 | +$25,559 | +2.5% |
Percent change is (September 2026 minus comparison month) divided by the comparison month, multiplied by 100. These broader Residential averages are not same-home appreciation.
Month | Average sold price |
|---|---|
September 2025 | $1,006,608 |
October 2025 | $921,789 |
November 2025 | $962,859 |
December 2025 | $977,056 |
January 2026 | $853,453 |
February 2026 | $793,615 |
March 2026 | $905,956 |
April 2026 | $980,009 |
May 2026 | $910,099 |
June 2026 | $992,212 |
July 2026 | $1,110,447 |
August 2026 | $922,458 |
September 2026 | $1,032,167 |
National 30-year fixed monthly rate
Month | Monthly average |
|---|---|
September 2025 | 6.35% |
October 2025 | 6.25% |
November 2025 | 6.24% |
December 2025 | 6.19% |
January 2026 | 6.10% |
February 2026 | 6.05% |
March 2026 | 6.18% |
April 2026 | 6.33% |
May 2026 | 6.44% |
June 2026 | 6.49% |
July 2026 | 6.54% |
August 2026 | 6.67% |
September 2026 | 6.86% |
Frequently Asked Questions
Do the pending events mean homes are selling faster?
They show that buyers moved forward. This event report does not measure selling speed, and the previous report is not a verified adjacent comparison window.
Is the average sold price what my home is worth?
No. It describes the homes that sold in that month. A useful estimate for your property starts with comparable sales and the home's own features and condition.
Sources And Scope
Weekly: NWMLS Matrix Market Watch, 7 Day view, captured October 21, 2026 at 10:39 a.m. PDT (17:39 UTC, UTC−07:00). Displayed lower boundary: 10/14/2026+. Exact upper cutoff and source query timezone were not recorded; a precise rolling 168-hour window is not established. Washington, King County, Shoreline MLS city; Single Family, Residential; source-coded styles 10–18, 25 and 26, with Attached/Zero Lot Line and Incomplete excluded. These filters approximate detached homes and are not an independent structural audit. MLS city geography can extend beyond municipal boundaries. No map, area, community, ZIP, price, year, broker or office restriction. Events can overlap and are not unique inventory.
Previous report: October 14 Shoreline update, October 7 onward through October 14 at 10:43 a.m. PDT. Exact boundary clocks, prior property-filter and excluded-status parity have not been verified. The periods are not established as contiguous, non-overlapping weeks. Raw matching-label differences are descriptive only.
Monthly: NWMLS InfoSparks, Shoreline (City), Monthly Average Sales Price, broader Residential, all saved property filters unrestricted. Exact chart date/value tooltips captured October 21, 2026 during the morning source collection; September 2025 through September 2026, complete months only. Prices are averages, not medians.
Rates: FRED MORTGAGE30US, US, percent, not seasonally adjusted; calendar-month arithmetic means of weekly observations. The retained October 21 production audit records validation of these thirteen monthly values against 56 weekly observations; this historical report has not been refreshed with current rates. Mortgage News Daily October 21 daily index checked at 2:35 p.m. PDT (21:35 UTC). The daily and monthly series need not match.
Let's Talk About Your Next Move
Jeremy Minor | Team NSRG | [email protected] | 206-349-9748
If you’re considering a move in Shoreline, I’m happy to help you compare the homes that fit your plans or think through a possible sale. Your timing, budget and priorities are a good place to start.