Wednesday, October 14, 2026 | Jeremy Minor, Team NSRG
Shoreline is seeing the seasonal shift in inventory. New listings have slowed down and pending transactions are catching up. Price drops are just as strong as ever, as Buyers continue to push for leverage and Sellers continue to look for the right price to attract said Buyers.
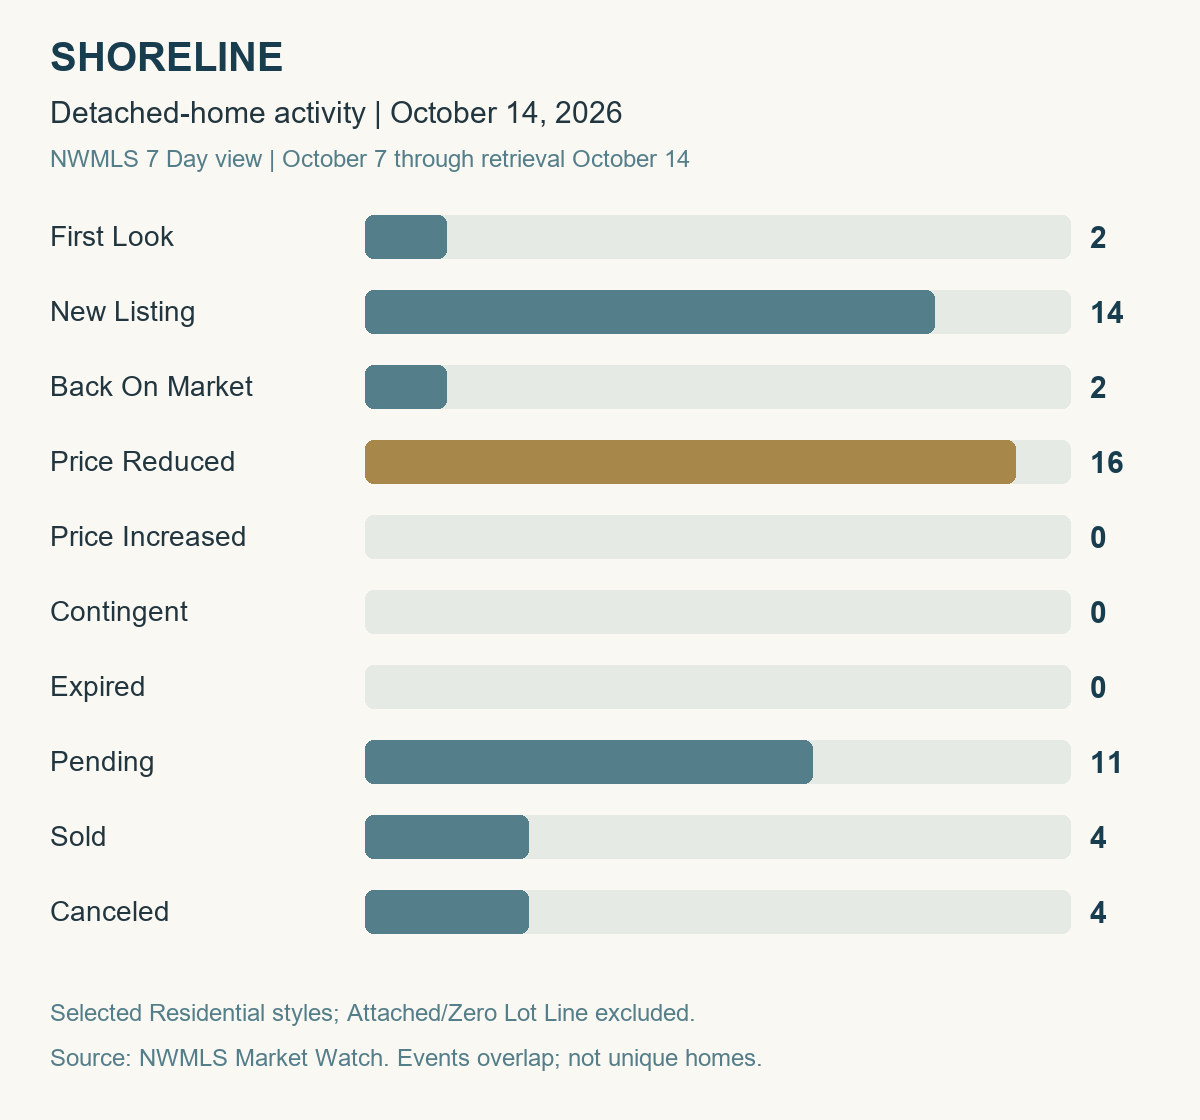
Shoreline's detached-home snapshot recorded 16 asking-price reductions alongside 14 new-listing events and 11 pending events.
Seven-Day Shoreline Detached-Home Activity
NWMLS Market Watch 7 Day view, October 7 through retrieval on October 14, 2026. Selected Residential house styles, with Attached/Zero Lot Line excluded; all prices.
Category | Events |
|---|---|
First Look | 2 |
New Listing | 14 |
Back On Market | 2 |
Price Reduced | 16 |
Price Increased | 0 |
Contingent | 0 |
Expired | 0 |
Pending | 11 |
Sold | 4 |
Canceled | 4 |
Categories can overlap. Do not add them together as unique homes or current inventory. New Listing is a listing-change category, not the total number of active listings.
The seven-day view also recorded two First Look events, two returns to market, four sold events, and four cancellations. There were no price-increase, contingent, or expired events in this query. The reductions suggest that some sellers are responding to the market, while the pending events show that buyers are still making commitments. These groups can overlap, and a cancellation alone does not tell us why a listing was withdrawn.
September Market Context
The monthly figures below use the broader InfoSparks Residential category for Shoreline City, with all styles, prices, and construction types. They do not reproduce the weekly detached-home search.
Median sale price and average days on market describe homes that closed during the reporting month, not homes still listed for sale. For those sold homes, days on market measures the time from listing to offer acceptance.
Metric | Sep 2025 | Aug 2026 | Sep 2026 | Year Over Year | Month Over Month |
|---|---|---|---|---|---|
Median sale price (sold homes) | $830,000 | $902,500 | $760,000 | -8.4% | -15.8% |
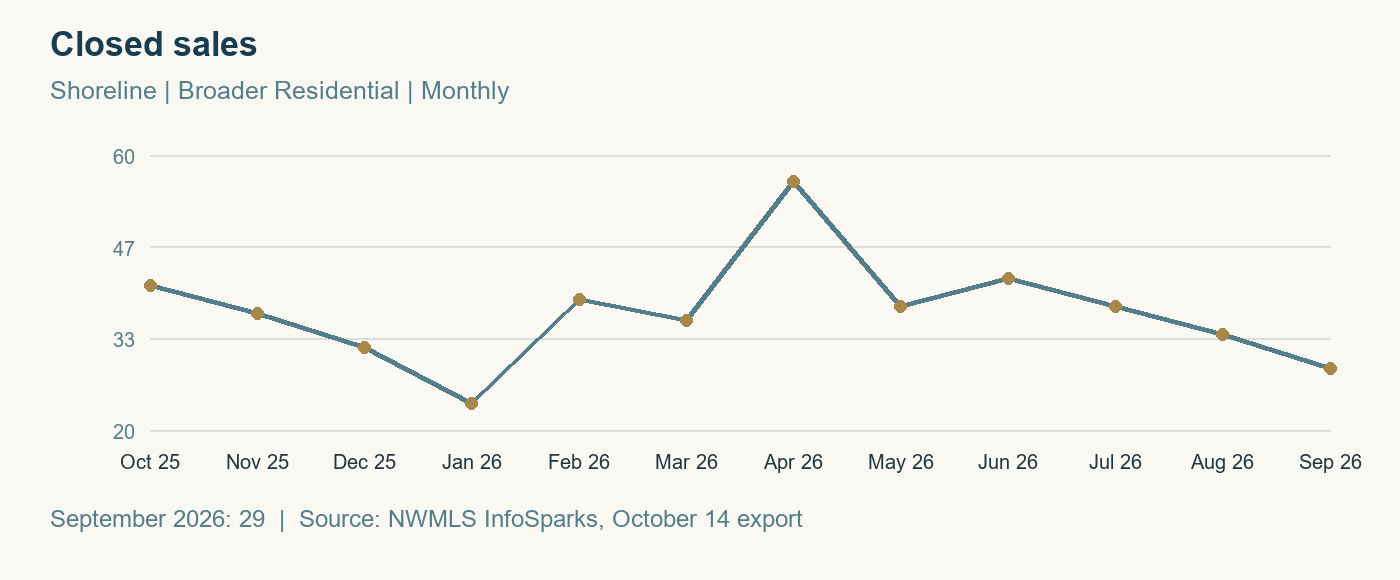
Closed sales | 40 | 34 | 29 | -27.5% | -14.7% |
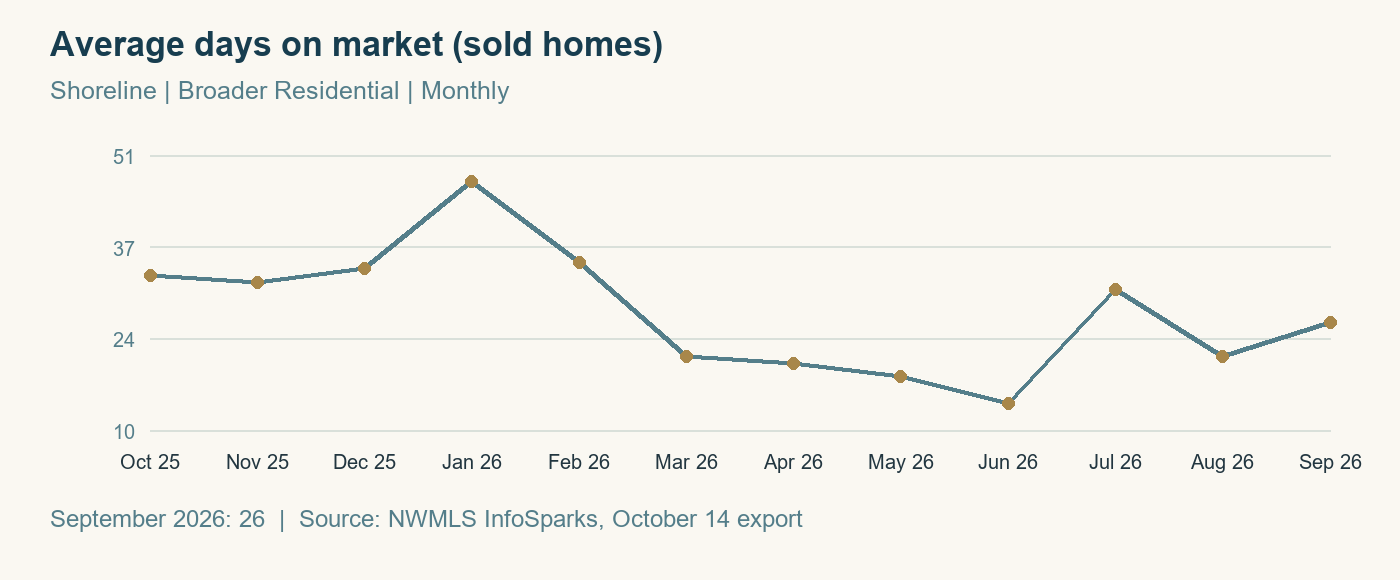
Average days on market (sold homes) | 23 | 21 | 26 | +13.0% | +23.8% |
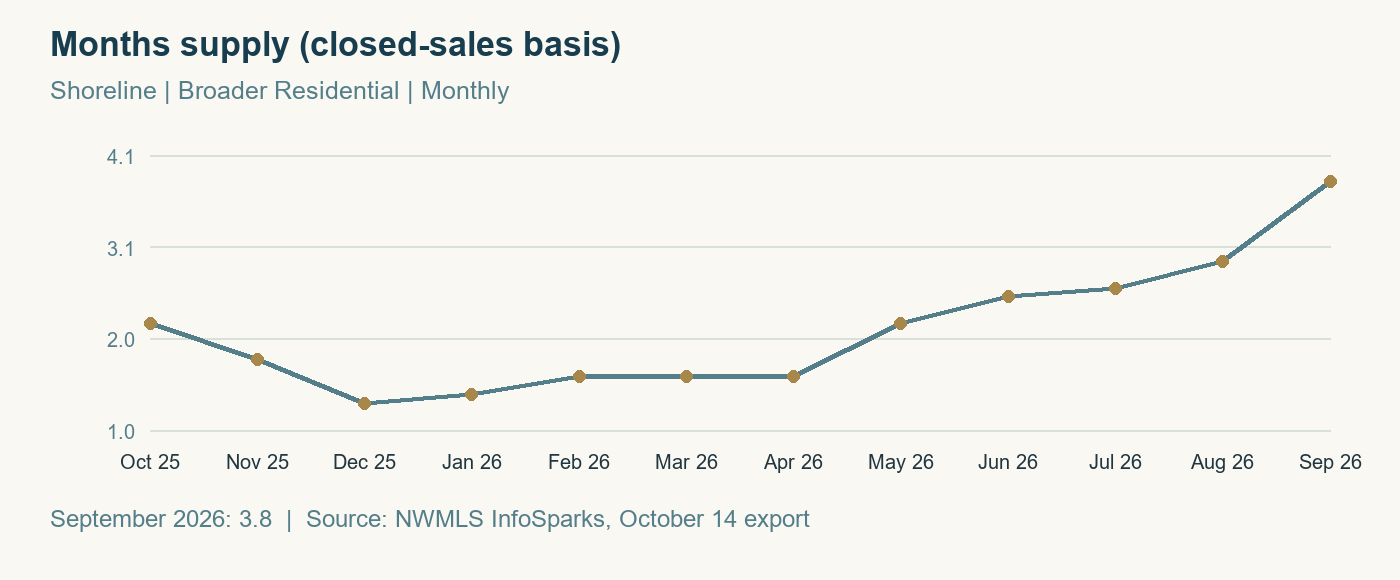
Months supply (closed-sales basis) | 2.3 | 2.9 | 3.8 | +65.2% | +31.0% |
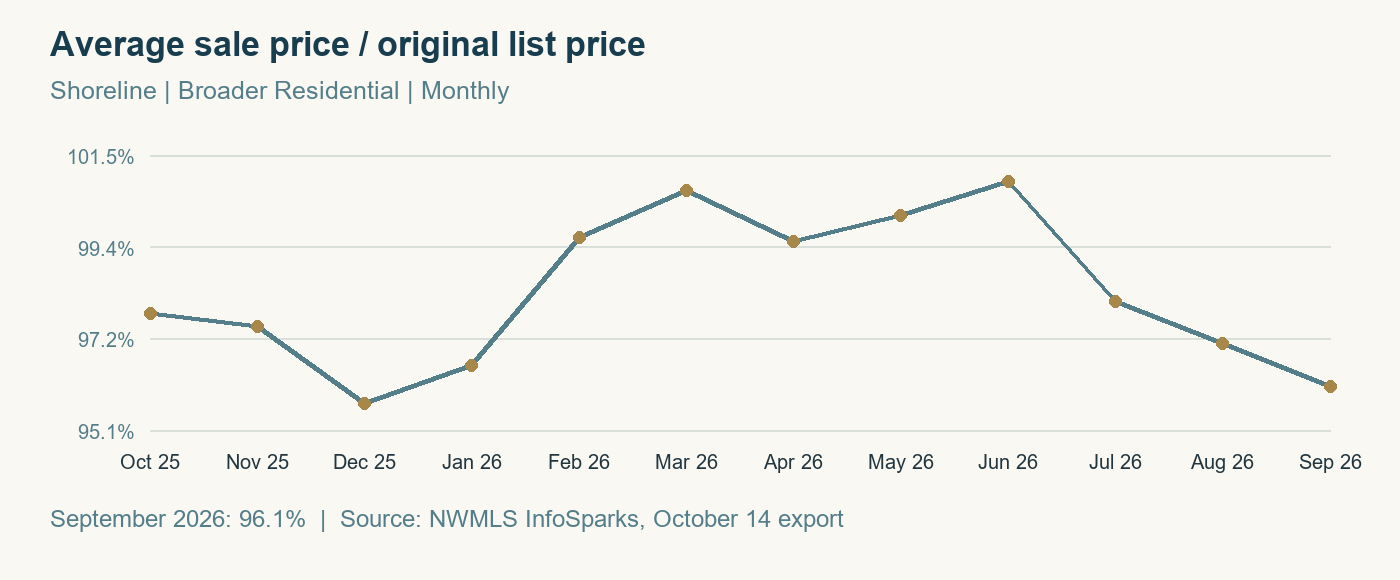
Average sale price / original list price | 98.8% | 97.1% | 96.1% | -2.7 pp | -1.0 pp |
Changes are relative percentages except pp, which means percentage points for the original-list-price ratio.
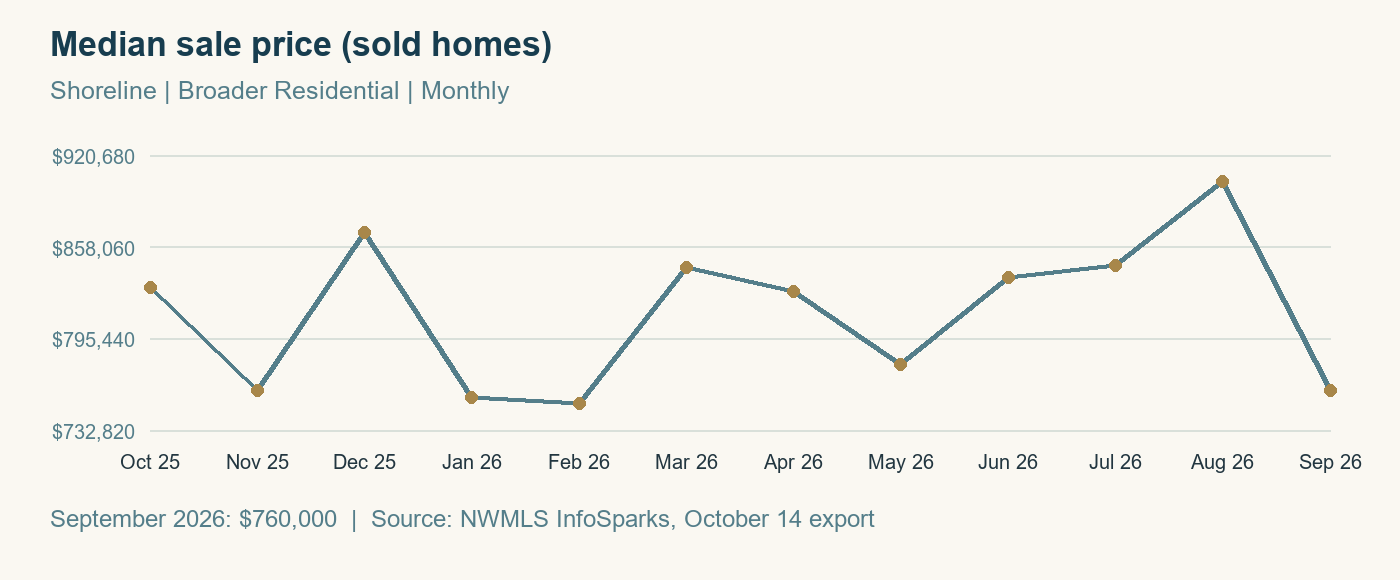
September's broader Residential median sale price was $760,000, down 8.4% from September 2025 and 15.8% from August 2026. Closed sales totaled 29, compared with 40 a year earlier and 34 in August. The median reflects the mix of homes that sold; it does not mean every Shoreline home changed in value by the same amount.
Average days on market for sold homes rose to 26, from 23 a year earlier and 21 in August. Months of supply increased to 3.8, compared with 2.3 last September and 2.9 in August. The average sale price was 96.1% of original list price, below 98.8% a year earlier and 97.1% in August. Together, these broader monthly measures support careful pricing and comparison shopping, without promising a discount on a particular home.
Twelve Months Of Local Context
October 2025 through September 2026. Broader Residential, monthly values; not rolling averages. Select a chart to open the full-size image.
Accessible Monthly Chart Data
Month | Median sale price (sold homes) | Closed sales | Average days on market (sold homes) | Months supply (closed-sales basis) | Average sale price / original list price |
|---|---|---|---|---|---|
October 2025 | $830,000 | 41 | 33 | 2.2 | 97.8% |
November 2025 | $760,000 | 37 | 32 | 1.8 | 97.5% |
December 2025 | $867,475 | 32 | 34 | 1.3 | 95.7% |
January 2026 | $755,000 | 24 | 47 | 1.4 | 96.6% |
February 2026 | $751,000 | 39 | 35 | 1.6 | 99.6% |
March 2026 | $843,750 | 36 | 21 | 1.6 | 100.7% |
April 2026 | $827,500 | 56 | 20 | 1.6 | 99.5% |
May 2026 | $777,500 | 38 | 18 | 2.2 | 100.1% |
June 2026 | $837,250 | 42 | 14 | 2.5 | 100.9% |
July 2026 | $845,000 | 38 | 31 | 2.6 | 98.1% |
August 2026 | $902,500 | 34 | 21 | 2.9 | 97.1% |
September 2026 | $760,000 | 29 | 26 | 3.8 | 96.1% |
What This Means For Buyers
If you are buying in Shoreline, compare condition, location, asking price, and recent comparable sales. Revisit homes with price changes when they fit your needs. A citywide average is useful context, but your offer should reflect the specific property and your budget.
What This Means For Sellers
If you are selling, price against today's alternatives and pay attention to the homes attracting offers. The weekly pending activity shows that buyers are still participating. Good presentation, clear pricing, and a willingness to respond to real feedback can help you compete.
Market Conclusion
In conclusion, one can hope that the market will approach a more balanced point. Average 30 year fixed rates continue to hover at around 7.50% (according to Mortgage News Daily). Inflation continues to push up everyday costs and erode purchasing power. Buyers want more inventory and leverage. Sellers want to maintain and gain value. In my opinion, the seasonal shift is providing necessary relief to the balance of the entire system. In my view, it also suggests that some sellers have enough equity and flexibility to hold off during the fall and winter months. If rates rise further, that hesitance could continue to dominate the conversation for as long as the equity holds out. If rates trend down, we could have a rapid reset in January 2027. Only time will tell.
Let’s Talk About Your Next Move
As we navigate these market changes together, my goal is for these updates to give you an increasingly clear picture of local trends. Buying and selling real estate takes an in-depth understanding of current conditions and where the market is heading. I'm here to help you make sense of both. My phone is always on, and I love to talk shop. Don't hesitate to reach out with your questions.
Jeremy Minor | Team NSRG | [email protected] | 206-349-9748