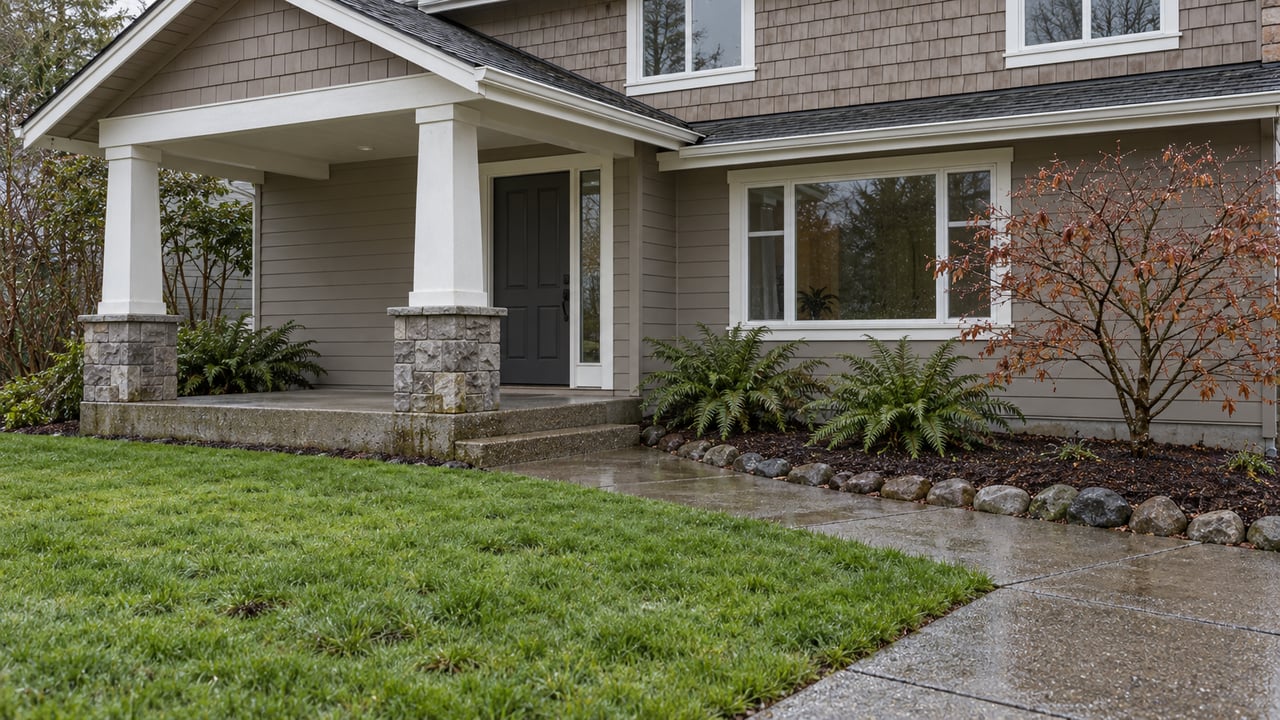

Seattle buyers have more room to compare, but the right home still deserves a focused plan. The October 22 seven-day snapshot recorded 128 Active listing events, 124 price reductions and 136 pending events. Those figures show fresh choices and ongoing decisions, rather than a simple measure of whether the whole city favors buyers or sellers.
For buyers: Revisit suitable homes with price adjustments and compare their condition, location and monthly cost with new alternatives. A lower asking price is a reason to take another look, not proof of a bargain.
For sellers: Price against the homes your likely buyers can choose today. Preparation and presentation matter, and early showing feedback can help you decide whether your launch price is doing its job.
This Week's Listing Activity
NWMLS Matrix 7 Day view, Seattle MLS city, captured October 22, 2026 at 7:31 a.m. PDT. The query starts October 15; the exact boundary clock is not displayed.
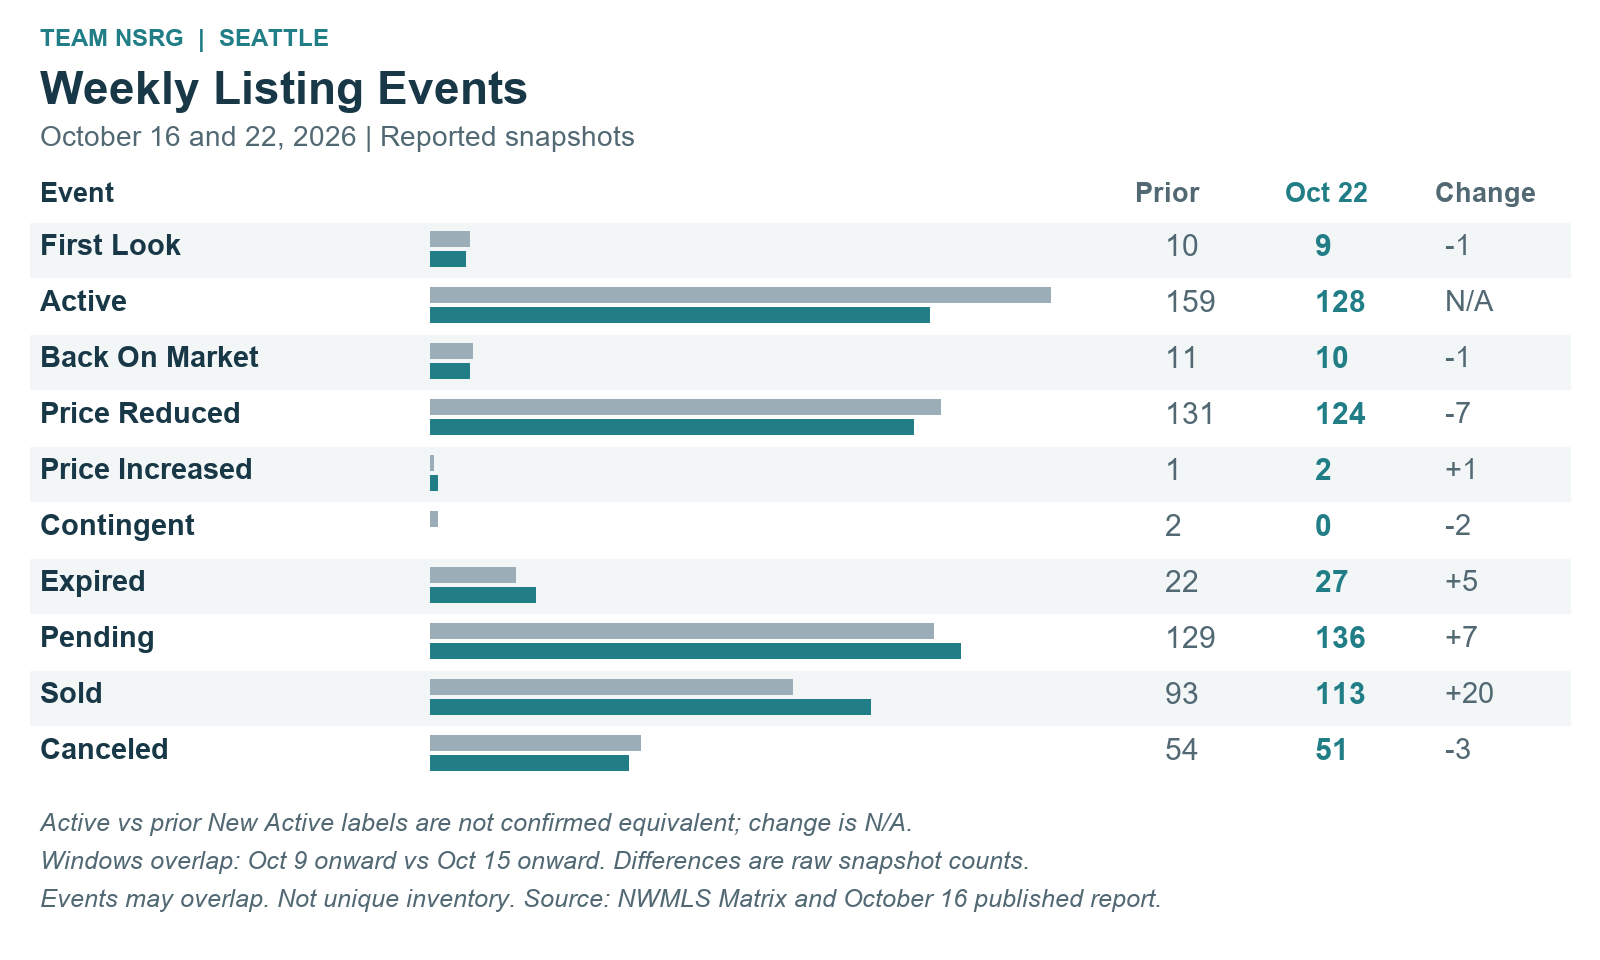
The October 16 report starts October 9; today's query starts October 15. These reporting windows overlap and are not consecutive, nonoverlapping weeks. Matching-label differences describe reported snapshots only, not a weekly growth rate. Active versus the prior New Active label has not been established equivalent, so its difference is N/A. Exact prior filter parity and clock cutoffs are unverified. A zero prior count would make its percentage change N/A. Events can overlap and cannot be summed as unique inventory.
The 136 pending events and 113 sold events show continued transaction activity. The 124 price reductions are a reminder that buyers are comparing alternatives. Pending and sold events reflect different stages of a transaction; neither should be subtracted from new listings to estimate today's inventory.
September Prices And Market Conditions
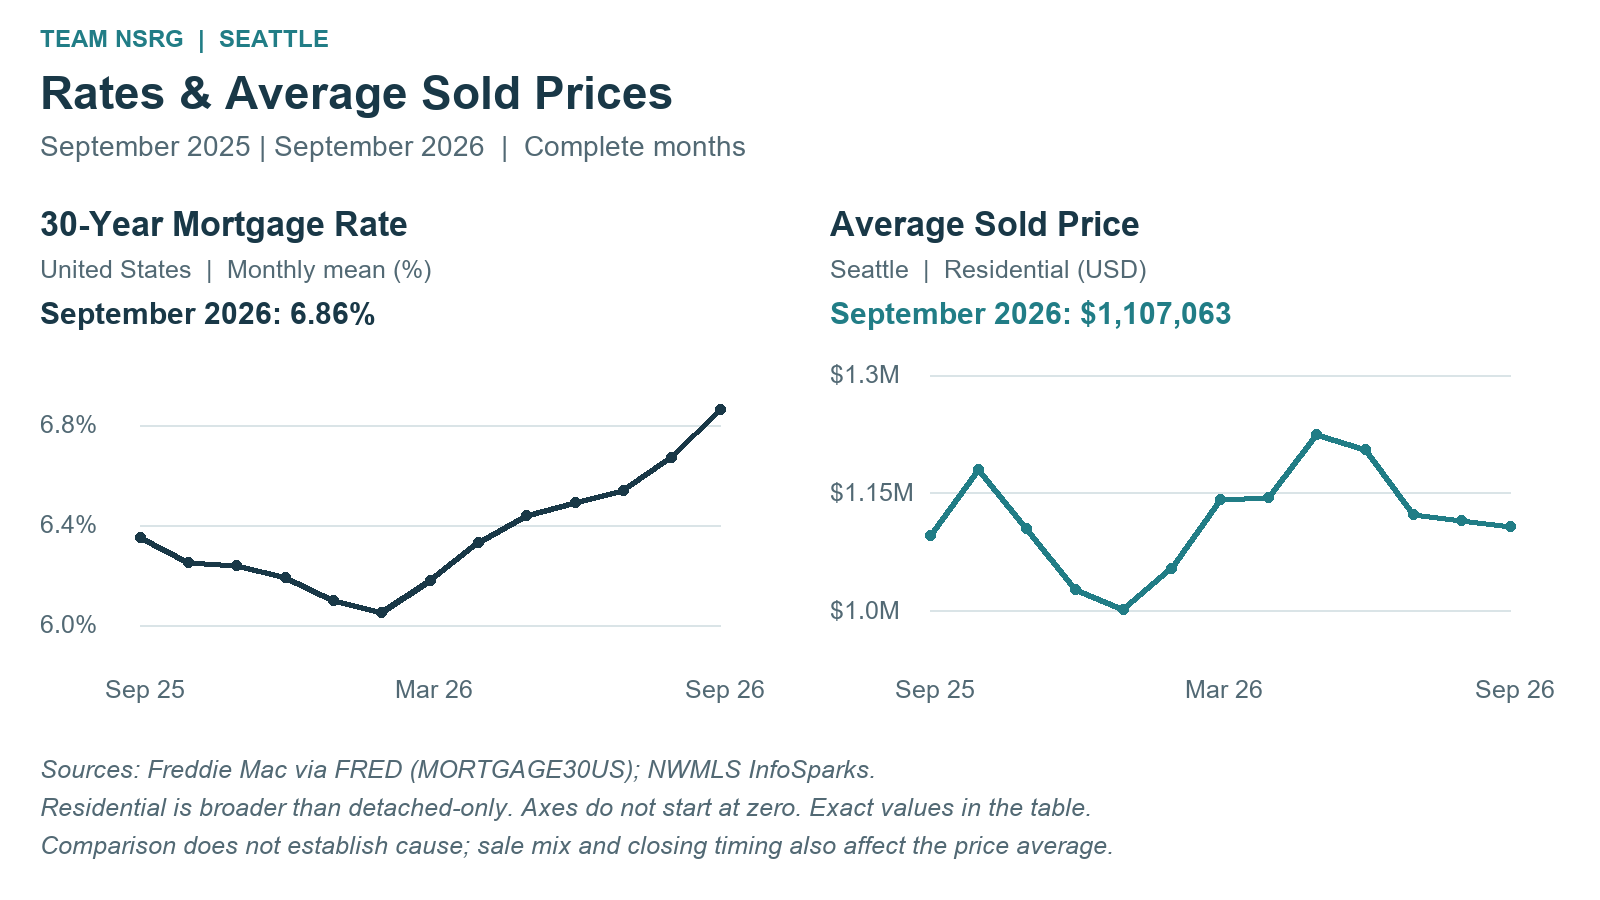
Seattle's average sold price was $1,107,063 in September 2026, up 1.1% from September 2025 and down 0.7% from August. This is an actual average of closed sales in the broader Residential category, not a median or a detached-only estimate.
September closed sales were lower than a year earlier while available homes were higher. That gives buyers more alternatives to weigh, but the average sold price alone cannot tell you what a particular home is worth. The mix of homes that closed, their condition and their neighborhoods all affect the average.
NWMLS InfoSparks: Seattle City, Residential, complete calendar months. Other property filters unrestricted. This monthly scope is broader than the detached-home weekly query. Average days on market describes homes that sold; it does not describe how long every active listing has been available.
Mortgage Rates And Average Sold Prices
The matched monthly view puts national financing conditions beside Seattle's closed-sale price trend. September's national 30-year mortgage-rate average was 6.86%, compared with 6.35% a year earlier. These parallel series provide context; they do not establish that a rate change caused a particular local price movement.
Current Mortgage Rate Environment
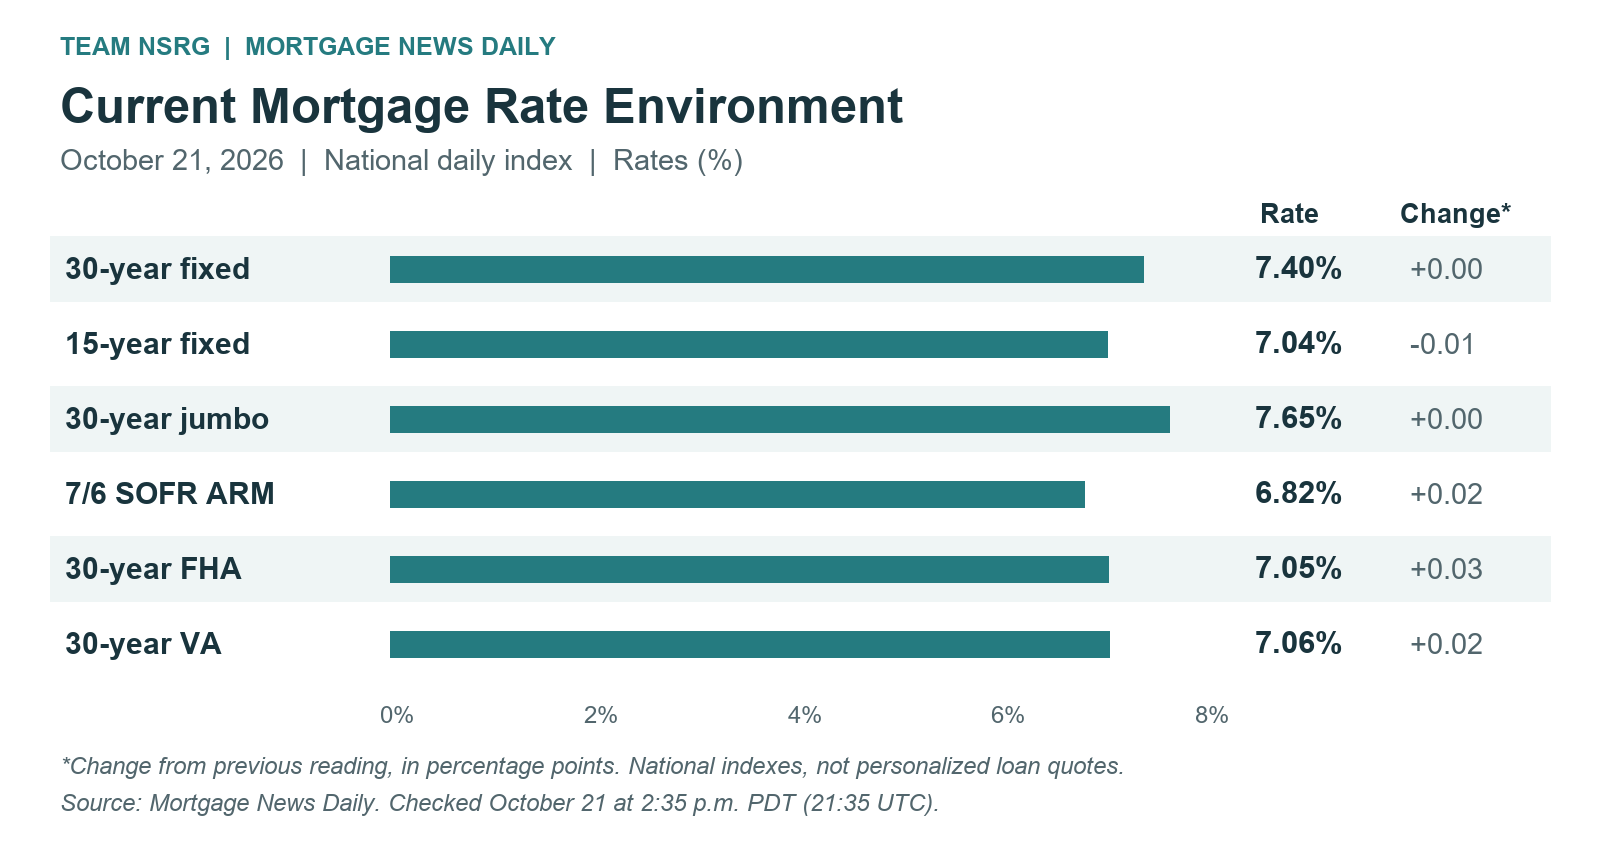
The latest MND reading available when checked on October 22 remained dated October 21. Mortgage News Daily's national daily index ended at 7.40% for a 30-year fixed mortgage, unchanged from the previous reading, after an earlier dip. This daily snapshot is separate from the monthly FRED averages above. Compare the full payment and loan terms with your lender; these indexes are not personalized loan quotes.
Open full-size current-rate graph · Live mortgage-rate dashboard · MND daily index
Loan product | Rate | Change (pp) |
|---|---|---|
30-year fixed | 7.40% | 0.00 |
15-year fixed | 7.04% | -0.01 |
30-year jumbo | 7.65% | 0.00 |
7/6 SOFR ARM | 6.82% | +0.02 |
30-year FHA | 7.05% | +0.03 |
30-year VA | 7.06% | +0.02 |
Source: Mortgage News Daily, October 21, 2026 daily index. Graph initially checked at 2:35 p.m. PDT and values rechecked October 22 during this morning's drafting. Daily changes are percentage points, not percent changes. National indexes differ from APRs and lender offers. Read the day's commentary.
Detailed Data And Comparisons
Weekly reported snapshots
Event | Oct 16 | Oct 22 | Raw difference |
|---|---|---|---|
First Look | 10 | 9 | -1 (-10.0%) |
Active / prior New Active | 159 | 128 | N/A |
Back on Market | 11 | 10 | -1 (-9.1%) |
Price Reduced | 131 | 124 | -7 (-5.3%) |
Price Increased | 1 | 2 | +1 (100.0%) |
Contingent | 2 | 0 | -2 (-100.0%) |
Expired | 22 | 27 | +5 (22.7%) |
Pending | 129 | 136 | +7 (5.4%) |
Sold | 93 | 113 | +20 (21.5%) |
Canceled | 54 | 51 | -3 (-5.6%) |
Monthly market measures: broader Residential
Measure | Sep 2025 | Aug 2026 | Sep 2026 |
|---|---|---|---|
Average sold price | $1,095,299 | $1,115,357 | $1,107,063 |
Closed sales | 499 | 463 | 413 |
Homes for sale | 1627 | 1775 | 1983 |
Average days on market — sold homes | 29 | 28 | 28 |
Months supply — closed sales | 2.9 | 3.4 | 3.8 |
Average sold price: broader Residential
Month | Average sold price |
|---|---|
2025-09 | $1,095,299 |
2025-10 | $1,179,555 |
2025-11 | $1,105,001 |
2025-12 | $1,026,990 |
2026-01 | $1,001,086 |
2026-02 | $1,054,150 |
2026-03 | $1,141,553 |
2026-04 | $1,144,659 |
2026-05 | $1,224,050 |
2026-06 | $1,204,762 |
2026-07 | $1,122,222 |
2026-08 | $1,115,357 |
2026-09 | $1,107,063 |
National 30-year fixed monthly rate
Month | US 30-year rate |
|---|---|
2025-09 | 6.35% |
2025-10 | 6.25% |
2025-11 | 6.24% |
2025-12 | 6.19% |
2026-01 | 6.10% |
2026-02 | 6.05% |
2026-03 | 6.18% |
2026-04 | 6.33% |
2026-05 | 6.44% |
2026-06 | 6.49% |
2026-07 | 6.54% |
2026-08 | 6.67% |
2026-09 | 6.86% |
Freddie Mac weekly survey via FRED MORTGAGE30US, calendar-month arithmetic means, September 2025 through September 2026. The shared rate series was previously validated against 56 weekly observations. Chart axes do not start at zero; exact values appear above.
Frequently Asked Questions
Do the weekly totals show how many homes are available?
No. They are listing-change events in the stated search window. One home may appear in more than one event category. The monthly homes-for-sale series measures a different concept and a broader Residential scope.
Does the average price describe my home's value?
No. Recent comparable sales and current alternatives with similar location, size and condition are a more useful starting point. A citywide average can move because a different mix of homes closed.
Sources And Scope
Weekly: NWMLS Matrix Market Watch, Single Family/Residential, Washington, King County, exact MLS city Seattle; detached-home styles, Attached/Zero Lot Line and Incomplete excluded. No map, area, community, ZIP, price, year, broker or office restriction. Captured October 22 at 7:31 a.m. PDT; displayed boundary 10/15/2026+. Earlier comparison: Team NSRG October 16 report, collected at 7:50 a.m. PDT with 10/9/2026+ boundary. The MLS city field can differ from municipal boundaries.
Monthly: NWMLS InfoSparks, Seattle City Residential; Average Sales Price, Closed Sales, Homes for Sale, Average Days on Market and Months Supply Closed; captured October 22 during this drafting session. Rates: FRED MORTGAGE30US. MND daily source rechecked October 22 and still dated October 21. Sources and listing availability can change. Artwork is a Seattle-inspired illustration, not a property photograph.
Let's Talk About Your Next Move
Jeremy Minor | Team NSRG | [email protected] | 206-349-9748
Seattle's latest snapshot combines fresh listings, frequent price adjustments and continuing pending activity, while September's broader Residential data shows more homes available than a year earlier. Your best next step depends on your budget, timing and the specific home. If you are considering buying or selling, I would be happy to discuss your options, compare suitable homes or recent sales, and help you build a plan that fits your goals.