Team NSRG · October 24, 2026 · By Jeremy Minor
Mill Creek buyers have more choices, and homes are still selling. September’s broader Residential figures show more homes for sale and more closed sales than a year earlier, with a higher average sold-home price. My read is that buyers can be selective, while sellers still have an opportunity to stand out with the right home at the right price.
For buyers: Compare the available homes and keep price, condition and location in perspective. A price reduction is a reason to take another look, not proof of a bargain.
For sellers: More choice means buyers can compare your home closely with the alternatives. Prepare well and make the asking price easy to justify.

This week in Mill Creek
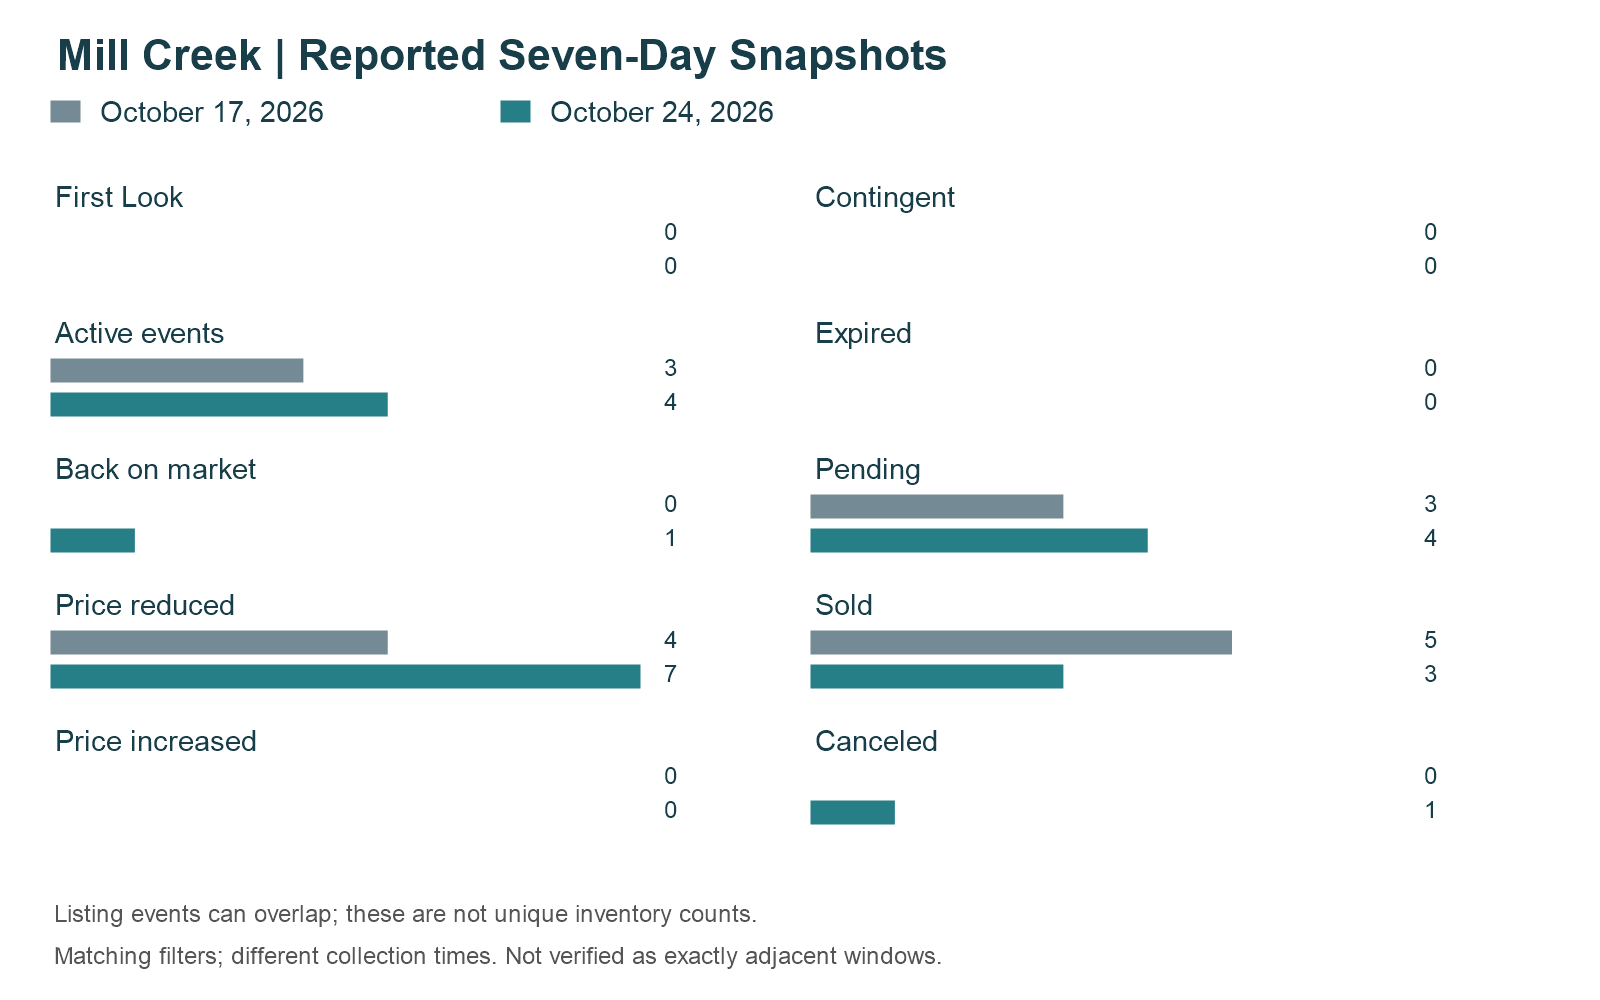
The latest NWMLS seven-day view recorded 4 pending events and 3 sold events alongside 7 price reductions. It is a small snapshot, but it shows both buyer activity and sellers adjusting prices. Our October 17 report recorded 3 pending events, 5 sold events and 4 price reductions; small counts can shift noticeably between reports.
Previous-report comparison
October 17 and October 24 are saved report snapshots collected at different times. This is a previous-report comparison, not a verified comparison of adjacent seven-day periods.
The numbers behind the update
Listing event | October 17 report | October 24 report |
|---|---|---|
First Look | 0 | 0 |
Active events | 3 | 4 |
Back on market | 0 | 1 |
Price reduced | 4 | 7 |
Price increased | 0 | 0 |
Contingent | 0 | 0 |
Expired | 0 | 0 |
Pending | 3 | 4 |
Sold | 5 | 3 |
Canceled | 0 | 1 |
Listing events can overlap; these are not unique inventory counts. Active events can include transitions and relistings.
The bigger picture
September’s broader Residential market had 44 homes for sale, compared with 31 a year earlier, and 19 closed sales, compared with 16. Average sold-home price was 6.6% higher year over year but 6.4% below August. My takeaway is a market offering more choice while still attracting buyers. The average-price figures are mixed enough that the comparable homes matter more than a citywide headline.
Monthly figures cover broader Residential homes, not detached-only homes. Average sold-home price also reflects the mix of homes sold; it is not a measure of appreciation for an individual home.
September figures: 2024, 2025 and 2026
Residential measure | September 2024 | September 2025 | September 2026 | Year over year |
|---|---|---|---|---|
Average sold-home price | $1,125,261 | $1,055,753 | $1,125,697 | +6.6% |
Closed sales | 19 | 16 | 19 | +18.8% |
Homes for sale | 30 | 31 | 44 | +41.9% |
From August to September
Residential measure | August 2026 | September 2026 | Month over month |
|---|---|---|---|
Average sold-home price | $1,202,057 | $1,125,697 | -6.4% |
Closed sales | 9 | 19 | +111.1% |
Homes for sale | 43 | 44 | +2.3% |
Mortgage rates and local average prices
From August to September, the national Freddie Mac 30-year fixed monthly average rose from 6.67% to 6.86%, while Mill Creek’s broader Residential average sold-home price moved from $1,202,057 to $1,125,697. These two complete months provide a limited comparison, not a sustained trend or evidence that rates caused the price change.
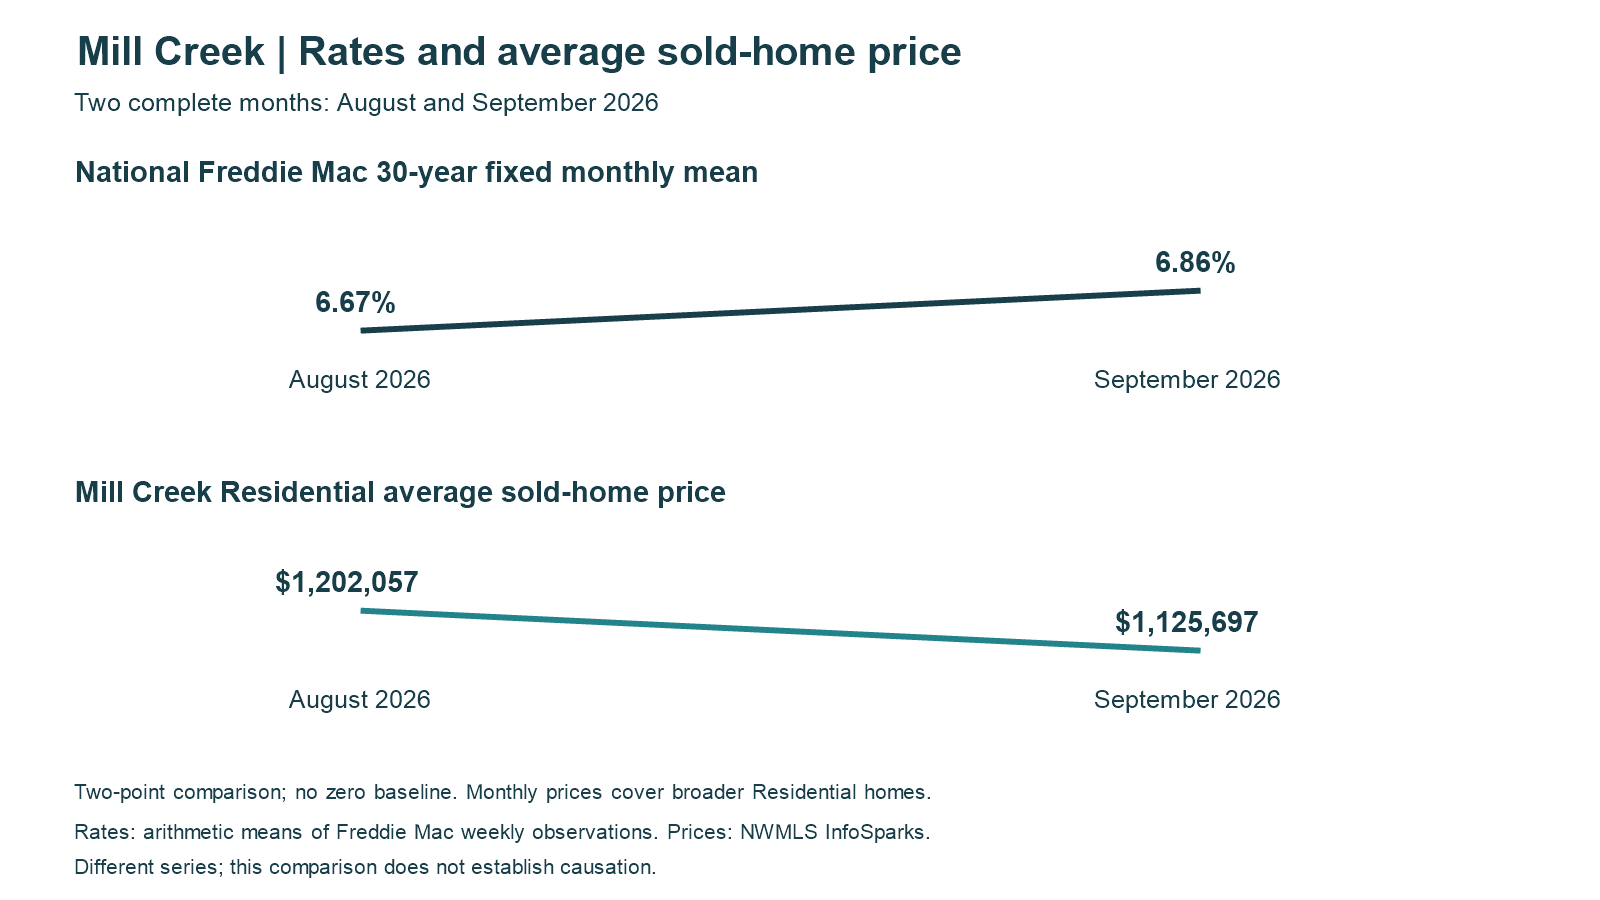
Rates: Freddie Mac PMMS weekly archive, United States, percent, not seasonally adjusted; calendar-month arithmetic means of Thursday observations. Exact means: August 6.6675%, September 6.8625%. FRED MORTGAGE30US series provides series context; the official monthly export was not retrieved. Prices: the verified InfoSparks Residential observations described below.
Current mortgage rate context
Mortgage News Daily reported a national 30-year fixed rate of 7.33% on October 23, 2026, up 0.03 percentage points that day. This dated snapshot offers financing context; it is not a live widget or a lender quote. Your rate depends on the loan and borrower details.
Mortgage product | October 23 rate | Daily change (percentage points) |
|---|---|---|
30-year fixed | 7.33% | +0.03 |
15-year fixed | 6.98% | +0.02 |
30-year jumbo | 7.60% | 0.00 |
7/6 SOFR ARM | 6.75% | -0.03 |
30-year FHA | 6.98% | +0.06 |
30-year VA | 6.99% | +0.05 |
View live Mortgage News Daily rates · View daily rate movement
Source: Mortgage News Daily, October 23, 2026 observations; retrieved October 24, 2026 at 11:38 p.m. PDT. National daily MND rates use a different methodology from monthly Freddie Mac/FRED averages; the series are not interchangeable. Rates do not establish the cause of city price changes.
What this means for your next move
Mill Creek calls for a home-by-home approach. Buyers have more to compare, and sellers have good reason to make their home’s value clear. If you are considering a move, I am happy to help you sort through the options and decide what these numbers mean for your home or search. - Jeremy
Click Below to View Listings
Matching Active-event listings
These public Team NSRG pages match MLS records in the October 17 onward Active-event query. Active events can include transitions and relistings; they are not necessarily first-ever listings. Current public status was verified as Active; availability can change.
- 3232 135th Place SE, Mill Creek WA, 98012 — MLS 2597600
- 2927 150th Lane SE, Mill Creek WA, 98012 — MLS 2596596
- 2619 133rd Place SE, Mill Creek WA, 98012 — MLS 2589449
- 2000 Village Green Drive Unit: 26, Mill Creek WA, 98012 — MLS 2592693
For 2000 Village Green Drive Unit 26 (MLS 2592693), NWMLS Client Full shows Single Family/Residential, style 12 — 2 Story, and Built On Lot. It matches the stated MLS-coded proxy; this is not independent verification of physical detachment.
Sources and scope
Weekly: NWMLS Market Watch, collected October 24, 2026 at 6:43:14.908 p.m. PDT. City Mill Creek; Snohomish County; Washington; all prices; Residential styles 10–18, 25 and 26; excluding Attached/Zero Lot Line and Incomplete status. This MLS-coded detached-home proxy does not independently verify construction. Current Active-event query starts October 17; the prior report query starts October 10. Exact clock boundaries were not displayed, so the report snapshots may overlap.
Monthly: NWMLS InfoSparks, City Mill Creek, Residential, unrestricted styles and prices; captured October 24, 2026. September is the latest complete month. The table compares September across years; the rate-and-price panel covers only August and September 2026. Percentages use displayed values and are rounded to one decimal; records and listing availability can change.
NWMLS Market Watch · InfoSparks (member sources)