October 13, 2026 | By Jeremy Minor, Team NSRG
Pricing matters in Lynnwood, and buyers have room to compare. This week brought 17 price reductions, 13 new listings and 10 listings moving to pending. Homes are still finding buyers, but my takeaway is that sellers need to pay close attention to the competition and buyers can take a thoughtful look at their options.
Seven-Day Lynnwood Detached-Home Activity
NWMLS activity from October 6 through retrieval on October 13, 2026.
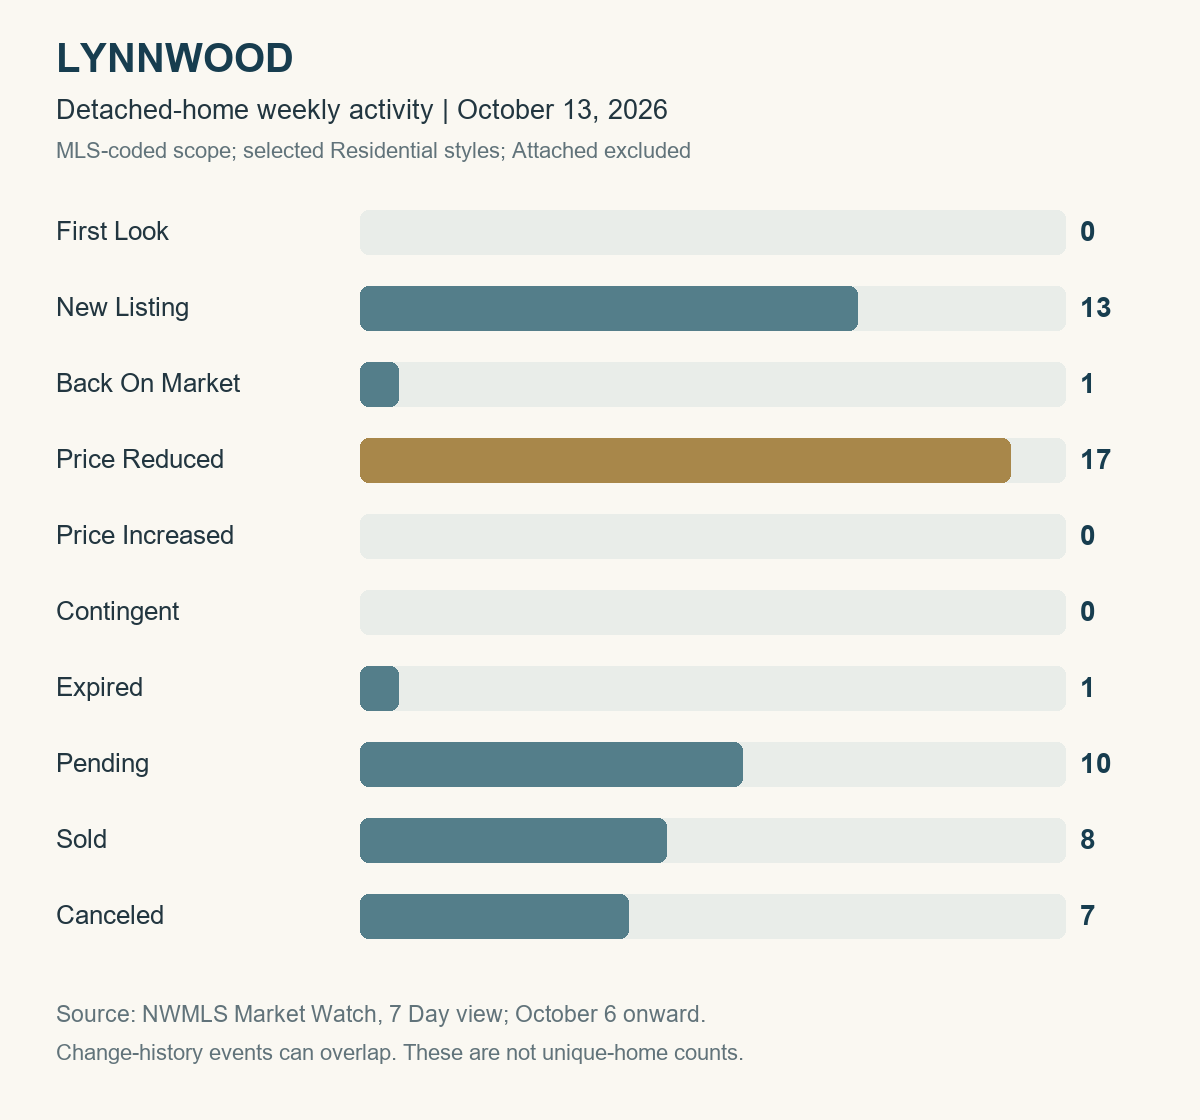
Open the weekly chart at full size
Market Watch category | Events |
|---|---|
First Look | 0 |
New Listing | 13 |
Back On Market | 1 |
Price Reduced | 17 |
Price Increased | 0 |
Contingent | 0 |
Expired | 1 |
Pending | 10 |
Sold | 8 |
Canceled | 7 |
What the Weekly Activity Tells Us
The price reductions are the clearest signal for sellers this week: asking prices need to fit the choices buyers have. Seventeen reductions accompanied 13 new listings and 10 pending listings. There were no First Look listings, and one home returned to the market. I would use that activity to compare your home with the properties attracting offers.
September 2026: Year over Year and Month over Month
Median sale price and average days on market describe homes that closed during the reporting month, not homes still listed for sale. For those sold homes, days on market measures the time from listing to offer acceptance.
Metric | Sep 2025 | Aug 2026 | Sep 2026 | Year over year | Month over month |
|---|---|---|---|---|---|
Median sale price (sold homes) | $730,000 | $800,000 | $678,498 | -7.1% | -15.2% |
Closed sales | 79 | 57 | 74 | -6.3% | +29.8% |
Average days on market (sold homes) | 36 | 23 | 27 | -25.0% | +17.4% |
Months supply (closed) | 1.8 | 3.0 | 3.3 | +83.3% | +10.0% |
Average % of original price | 96.3% | 97.1% | 96.1% | -0.2 pp | -1.0 pp |
Year-over-year and month-over-month changes are relative percentages; pp means percentage points for the original-list-price ratio.
September brought more closings than August, even as the median price moved lower. The median sale price was $678,498, down 15.2% from August and 7.1% from September 2025. Closed sales increased from 57 in August to 74 in September, compared with 79 a year earlier.
Buyers had more room to compare in September than in August. Average days on market increased from 23 to 27, while months of supply rose from 3.0 to 3.3. Homes sold for an average of 96.1% of their original asking price. Those numbers make a good case for thoughtful offers and realistic seller expectations.
12-Month Broader Residential Trends
The charts below put September in context, showing monthly results from October 2025 through September 2026.
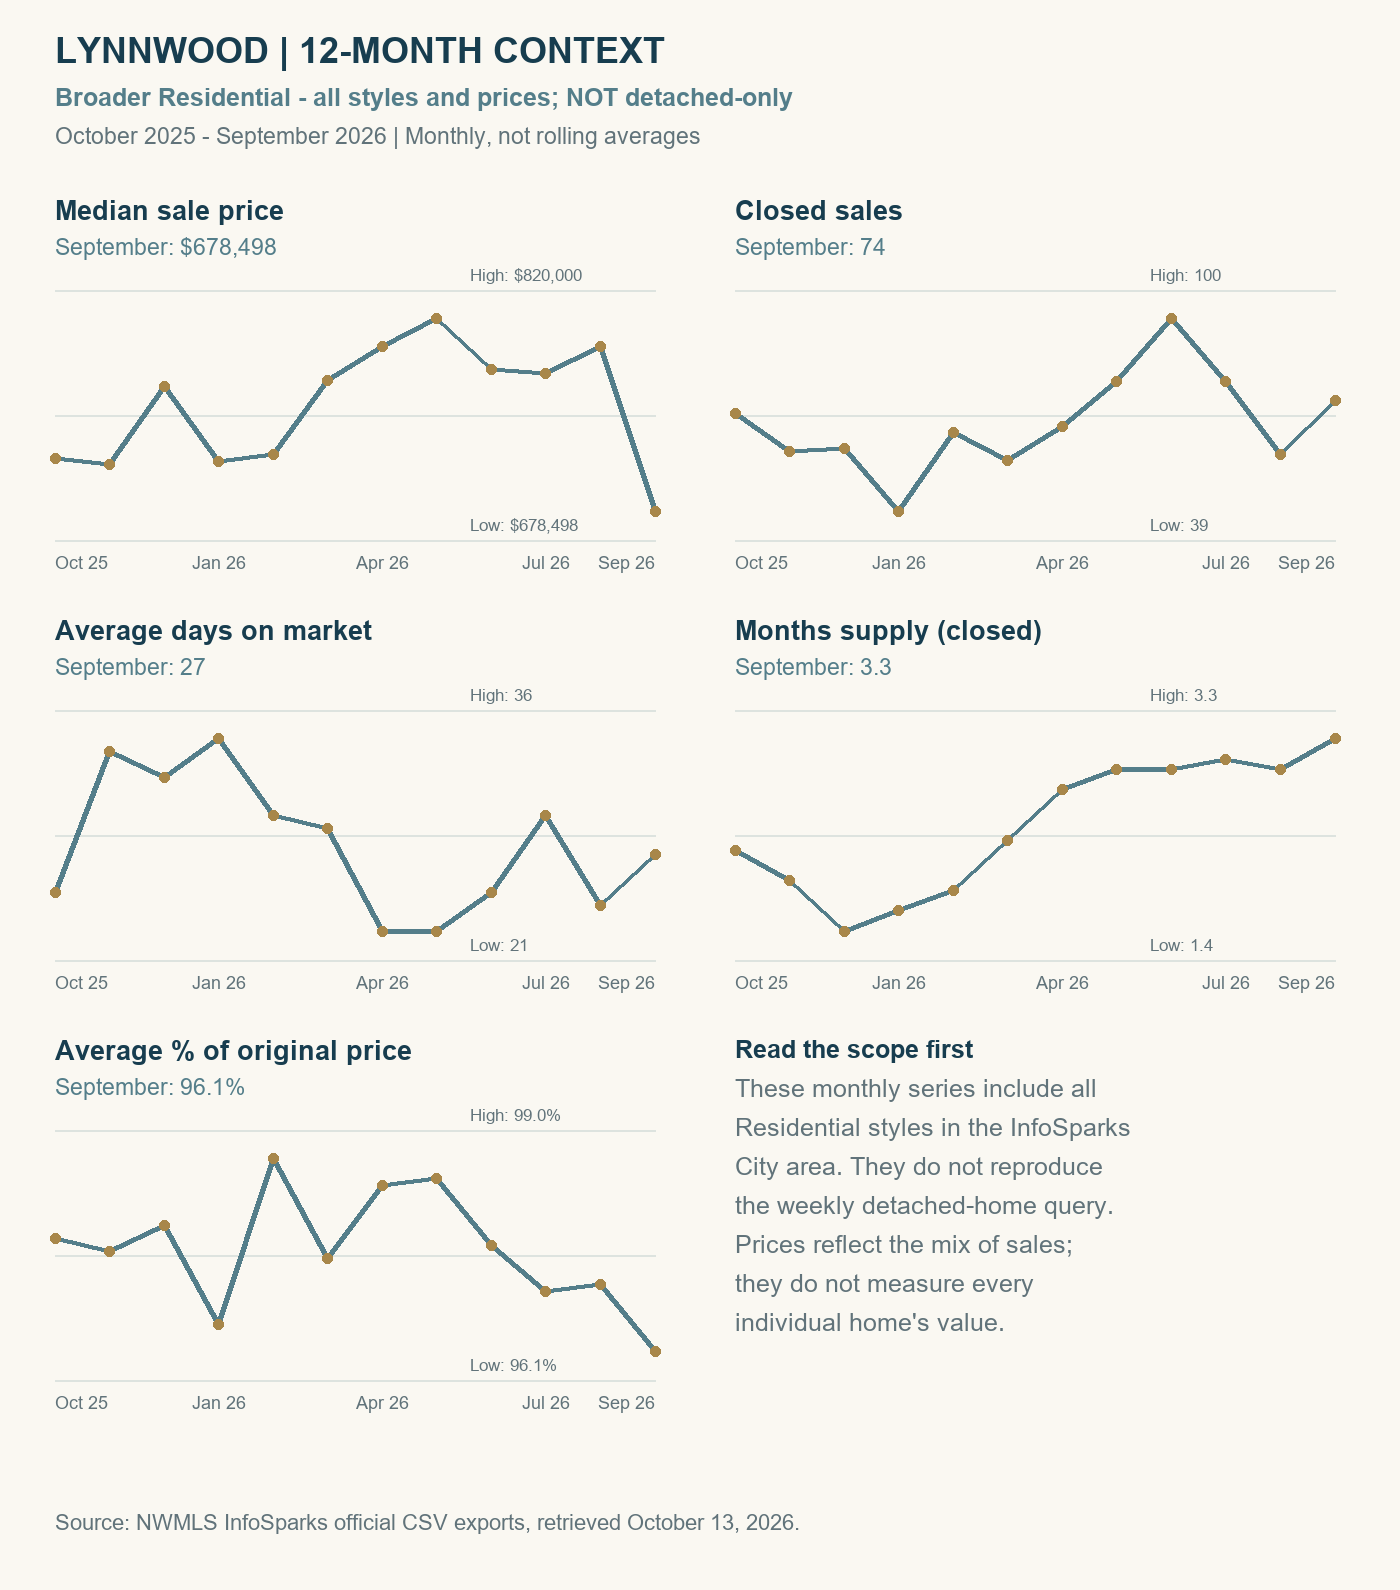
Open the 12-month trend charts at full size
What Buyers Can Take from This
If you are buying in Lynnwood, take a fresh look at homes with price reductions that fit your needs. Compare condition, recent sales and the monthly ownership cost to decide which options offer the best fit for you.
What Sellers Can Take from This
If you are selling, make it easy for buyers to see the value in your home. Good preparation and a price that reflects current competition give you a stronger start. Pay attention to showing feedback and the homes attracting offers as you decide your next step.
As we navigate these market changes together, my goal is for these updates to give you an increasingly clear picture of local trends. Buying and selling real estate takes an in-depth understanding of current conditions and where the market is heading. I’m here to help you make sense of both. My phone is always on, and I love to talk shop. Don’t hesitate to reach out with your questions.
Jeremy Minor | Team NSRG | [email protected] | 206-349-9748
Sources and Data Note
The weekly search focuses on detached single-family homes in Lynnwood, across all prices, based on NWMLS classifications and excluding attached or zero-lot-line listings. Weekly activity categories can overlap. Monthly Residential data includes a broader mix of homes, so it is not directly comparable to the detached-home weekly view.
Retrieved: Market Watch 2026-10-13T15:36:34.195Z; InfoSparks exports dated October 13, 2026.
NWMLS Market Watch member portal | NWMLS InfoSparks. Member access required.