

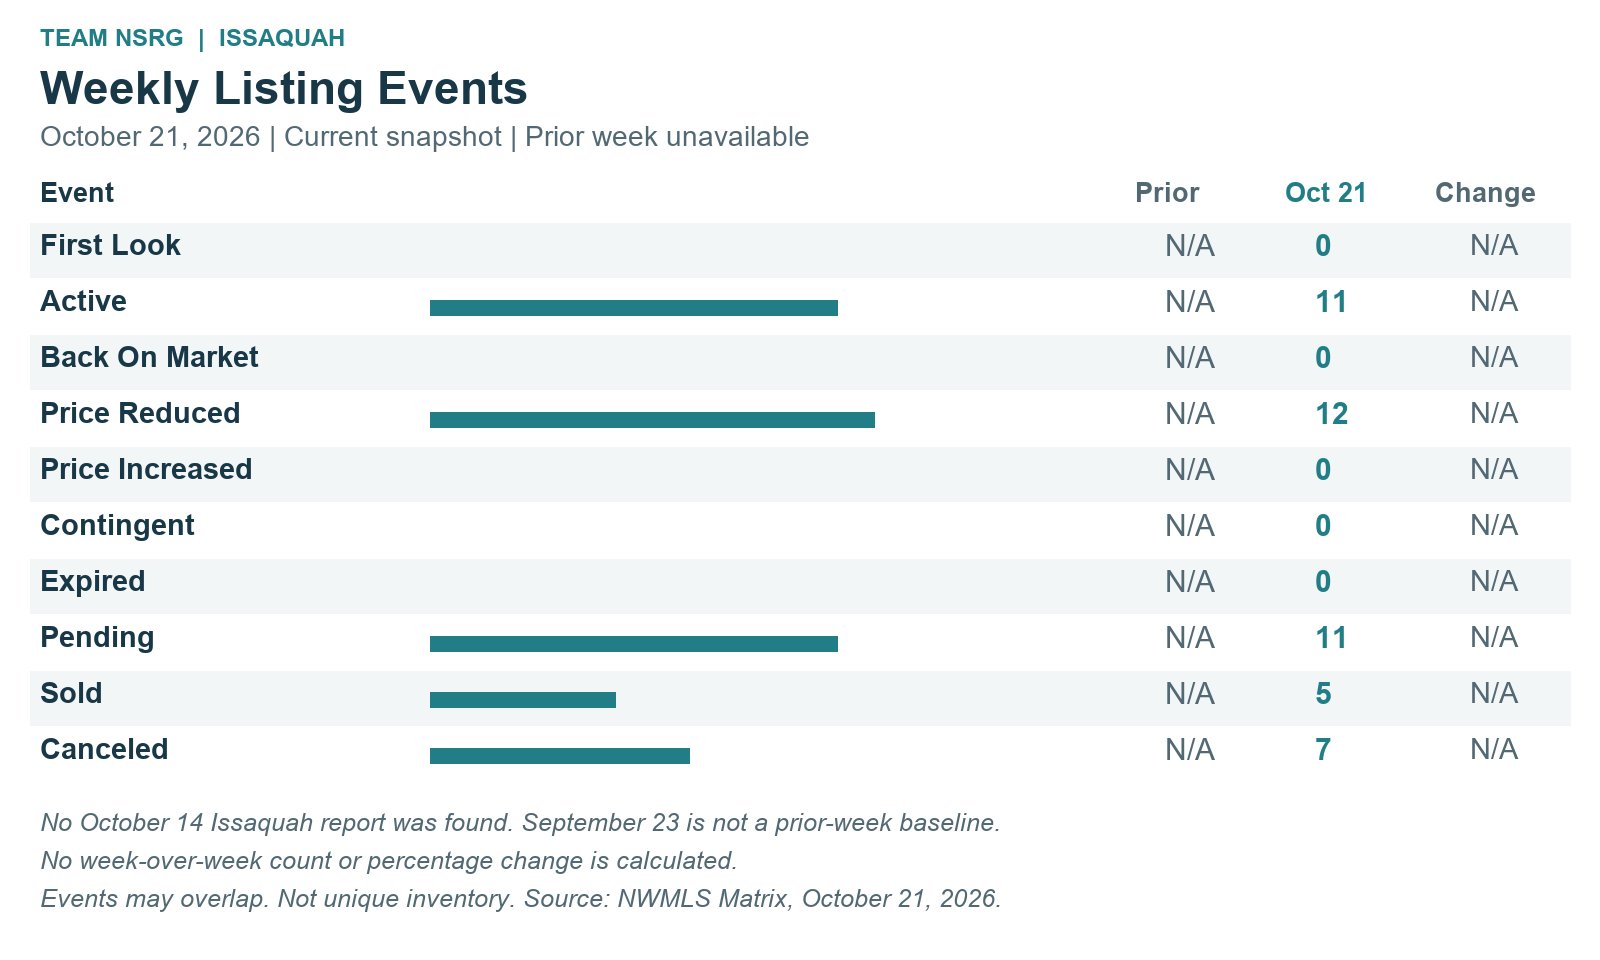
In Issaquah, give a price adjustment a second look when the home fits your plans. The October 21 seven-day snapshot recorded 11 Active listing events, 12 price reductions and 11 pending events. Buyers have reasons to revisit their shortlist, while sellers need to make a clear case for their asking price.
For buyers: Compare condition, location and the full monthly payment with similar homes. A reduced asking price creates a fresh decision point; it does not automatically make a home a bargain.
For sellers: The pending events show that buyers are moving forward on some homes. Use nearby comparable sales, competing listings and your own showing feedback to guide pricing and preparation.
This Week's Listing Activity
NWMLS Matrix 7 Day view, Issaquah, captured October 21, 2026 at 5:33 p.m. PDT. Exact collection timestamps and reporting limits appear below.
Event | Oct 21 | Prior week / change |
|---|---|---|
First Look | 0 | N/A |
Active | 11 | N/A |
Back On Market | 0 | N/A |
Price Reduced | 12 | N/A |
Price Increased | 0 | N/A |
Contingent | 0 | N/A |
Expired | 0 | N/A |
Pending | 11 | N/A |
Sold | 5 | N/A |
Canceled | 7 | N/A |
No October 14 Issaquah report was found in the CMS search. The latest earlier report is September 23, not an adjacent weekly baseline, so count and percentage changes are unavailable—not zero. The query displays October 14 onward; exact clock cutoffs are unavailable. Event categories may overlap and cannot be added as unique inventory.
Five sold events and seven cancellations round out the current activity. These describe changes recorded during the reporting window; completed sales reflect decisions made earlier and do not measure today's pace of offers.
September Prices In Context
Average sold price was $1,471,584 in September 2026, down 9.1% from August's $1,618,395 and 5.5% from September 2025's $1,556,761. This monthly series covers the broader Residential category, rather than the detached-home filters used for the weekly report.
An average describes the mix of homes that closed that month. It does not mean every Issaquah home lost 5.5% of its value. Recent sales with similar location, size and condition provide a more useful starting point for your own decision.
Measure | Sep 2025 | Aug 2026 | Sep 2026 |
|---|---|---|---|
Average sold price | $1,556,761 | $1,618,395 | $1,471,584 |
Closed sales | 36 | 38 | 33 |
Homes for sale | 110 | 145 | 162 |
Average days on market, sold homes | 22 | 25 | 19 |
Months of supply, closed-sales measure | 3.3 | 4.3 | 4.8 |
September offered more homes for sale than August or a year earlier, while the homes that closed spent an average of 19 days on the market. Those measures describe different groups of homes. Together they are a reminder to judge the alternatives in your price range rather than assume every listing faces the same competition.
Months of supply estimates how long inventory would last at the report's sales pace. It does not predict an individual home's time to sell. Days on market and average price above refer to sold homes.
Mortgage Rates And Home Sale Prices
The national 30-year fixed mortgage rate averaged 6.86% in September, compared with 6.67% in August and 6.35% a year earlier—differences of 0.19 and 0.51 percentage points. Keep the payment budget in view as you compare homes.
The chart matches the same complete months for rates and local average sold prices. Their movement does not establish cause: borrowing costs, the mix of homes sold and closing timing all matter.
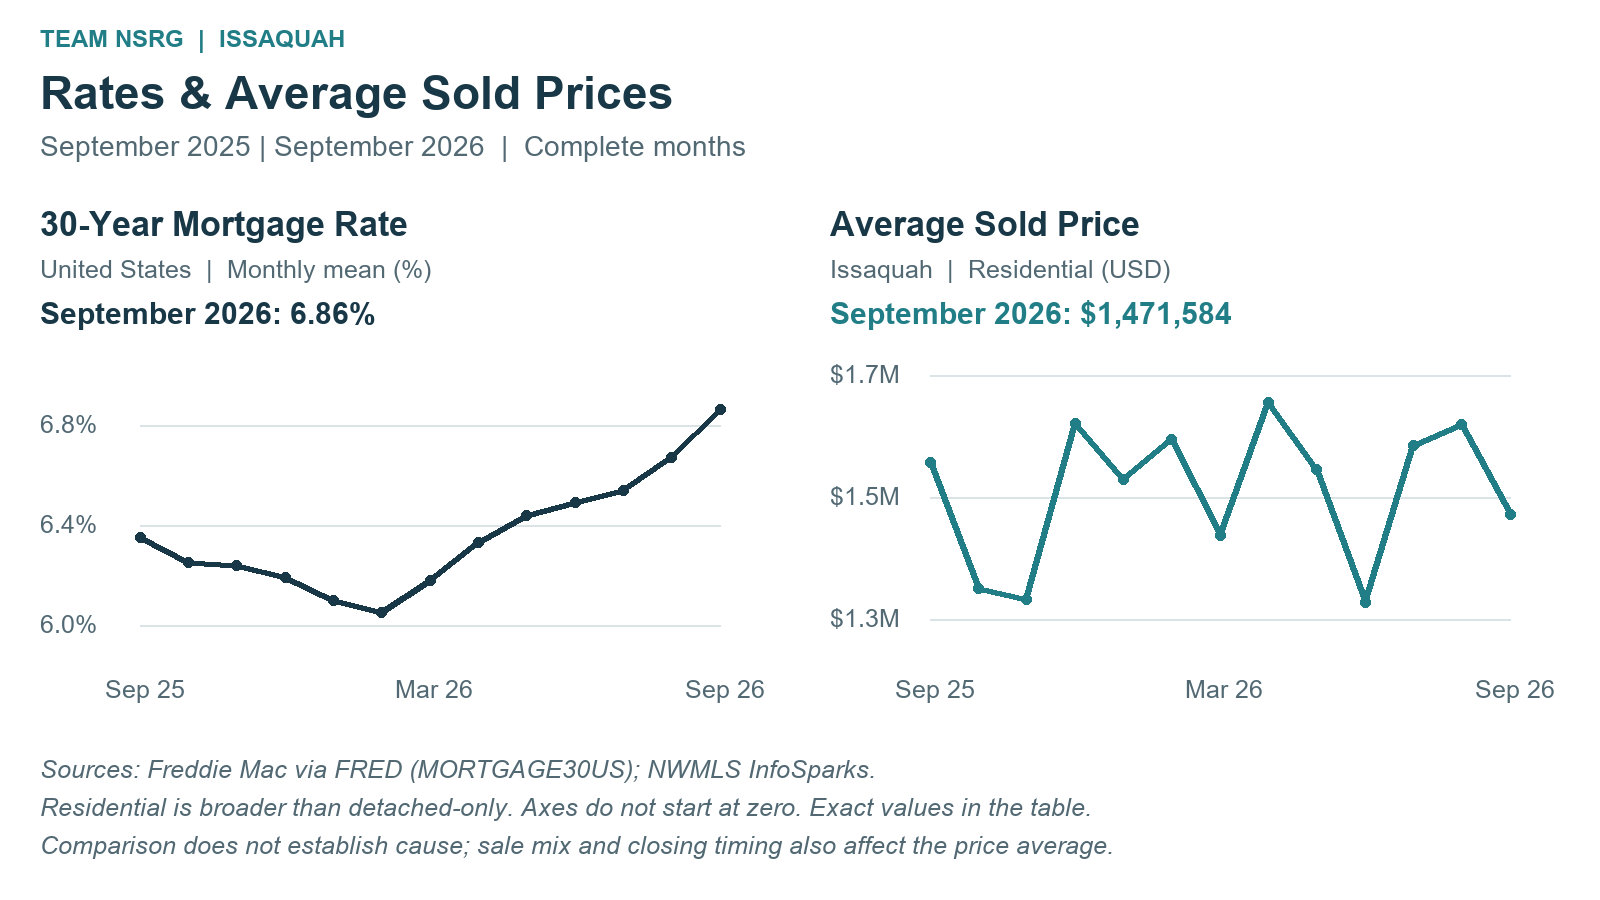
Open full-size monthly chart. Exact monthly values are in the table below.
Current Mortgage Rate Environment
Mortgage News Daily's October 21 national daily index ended at 7.40% for a 30-year fixed mortgage, unchanged from the previous reading, after an earlier dip. This daily snapshot is separate from the monthly FRED averages above. Compare the full payment and loan terms with your lender; these indexes are not personalized loan quotes.
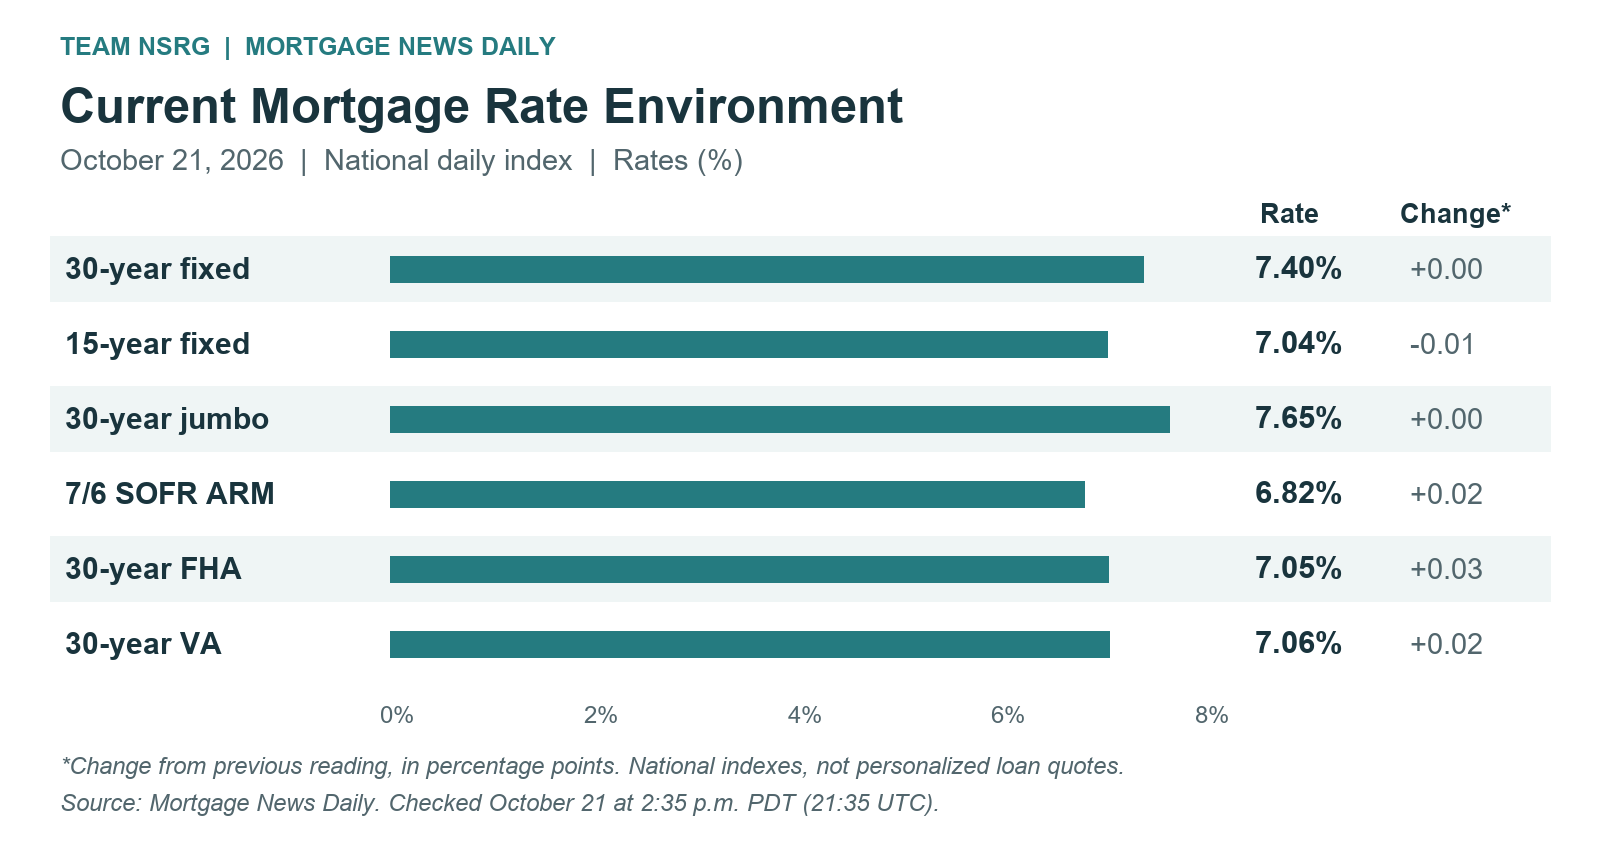
Open full-size current-rate graph · Live mortgage-rate dashboard · MND daily index
Loan product | Rate | Change (pp) |
|---|---|---|
30-year fixed | 7.40% | 0.00 |
15-year fixed | 7.04% | -0.01 |
30-year jumbo | 7.65% | 0.00 |
7/6 SOFR ARM | 6.82% | +0.02 |
30-year FHA | 7.05% | +0.03 |
30-year VA | 7.06% | +0.02 |
Source: Mortgage News Daily, October 21, 2026 daily index. Graph initially checked at 2:35 p.m. PDT and values rechecked during this evening's drafting. Daily changes are percentage points, not percent changes. National indexes differ from APRs and lender offers. Read the day's commentary.
Click Below to View Listings
View Eleven Seven-Day Active Event Listings
This OneHome link is the verified saved selection of 11 Issaquah Active-event listings from the detached-home query, not a rolling search. Availability and status can change. The snapshot recorded zero First Look listings, so there is no First Look listing set to link.
Monthly Data And Earlier Context
Month | Average sold price | US 30-year rate |
|---|---|---|
2025-09 | $1,556,761 | 6.35% |
2025-10 | $1,350,998 | 6.25% |
2025-11 | $1,332,981 | 6.24% |
2025-12 | $1,621,029 | 6.19% |
2026-01 | $1,529,755 | 6.10% |
2026-02 | $1,594,531 | 6.05% |
2026-03 | $1,437,450 | 6.18% |
2026-04 | $1,655,577 | 6.33% |
2026-05 | $1,545,803 | 6.44% |
2026-06 | $1,327,504 | 6.49% |
2026-07 | $1,584,965 | 6.54% |
2026-08 | $1,618,395 | 6.67% |
2026-09 | $1,471,584 | 6.86% |
Sources: NWMLS InfoSparks Monthly Average Sales Price, Issaquah City, Residential; Freddie Mac weekly survey via FRED MORTGAGE30US, calendar-month arithmetic means. September 2025–September 2026 complete months. These are actual sold-home averages, not medians. Chart axes do not start at zero.
The September 23 Issaquah report recorded 14 new Active events, 17 reductions, 10 pending and six sold. It is useful historical context, but four weeks separate its publication from this update. Exact filter and reporting-window parity cannot be established, so it is not used to calculate a weekly change.
Frequently Asked Questions
Do the price reductions mean every home is worth less?
No. They show changes in asking prices for some listings. A home's value depends on comparable sales, condition, location and the choices available to buyers.
Why is the monthly price series broader than the weekly report?
The weekly query uses detached-home filters. The monthly InfoSparks series is Residential with other property filters unrestricted. Keeping those scopes explicit avoids treating the two groups as identical.
Sources And Scope
Weekly: NWMLS Matrix Market Watch, 7 Day view, captured October 21, 2026 at 5:33 p.m. PDT (October 22 at 00:33 UTC). Displayed boundary: 10/14/2026+. Washington, King County, Issaquah MLS city, Single Family/Residential, detached-home property filters; Attached/Zero Lot Line and Incomplete excluded. No map, area, community, ZIP, price, year, broker or office restriction. Exact boundary clock is unavailable; events may overlap.
Monthly: NWMLS InfoSparks, Issaquah City, Residential, Monthly Average Sales Price, Average Days on Market for sold homes, Closed Sales, Homes for Sale and Months Supply Closed. Other property filters unrestricted. Exact price tooltips captured October 21 at 5:34 p.m. PDT (October 22 at 00:34 UTC); other metric tooltips captured in the same drafting session; complete months only. Rates: FRED MORTGAGE30US, US percent, not seasonally adjusted; shared 13-month series previously validated against 56 weekly observations. MND daily values rechecked during this draft and remain dated October 21.
Artwork is an original Issaquah-inspired illustration, not a photograph or a depiction of a specific property.
Let's Talk About Your Next Move
Jeremy Minor | Team NSRG | [email protected] | 206-349-9748
Issaquah's latest snapshot brings 12 price reductions and 11 pending events into focus, while September's broader Residential figures show more available homes and an average sold price of $1,471,584. The right next step depends on your budget, timing and the particular home—not one weekly headline. If you are considering buying or selling, I would be happy to discuss your options, compare suitable homes or nearby sales, and help you build a plan that fits your goals.