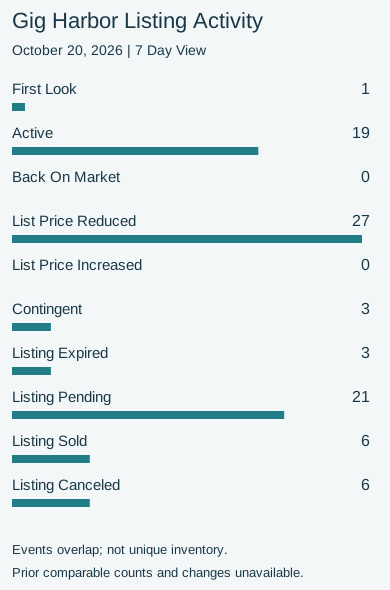
Buyers are still buying in Gig Harbor. The October 20 report recorded 21 moves to pending—homes going under contract—alongside 19 new active listings and one First Look listing. That puts accepted offers almost level with those 20 fresh listing entries. With 27 price reductions also recorded, sellers are adjusting their asking prices. These numbers suggest an active market where thoughtful pricing and a well-prepared home can help sellers attract buyers.
For Buyers: If a home you like has had a price cut, take another look. Sellers are adjusting, and buyers are still making offers. Compare the home’s condition, location and recent nearby sales to decide whether the new price works for you—and be ready to act when the right fit comes along.
For Sellers: The takeaway is encouraging: buyers are responding, and homes are going under contract. Put your energy into what you can control—a thoughtful asking price, repairs and presentation that help your home stand out, and a willingness to listen to showing feedback. Those steps can help turn buyer interest into an offer.
This Week’s Listing Activity
Event | Count |
|---|---|
First Look | 1 |
Active | 19 |
Back On Market | 0 |
List Price Reduced | 27 |
List Price Increased | 0 |
Contingent | 3 |
Listing Expired | 3 |
Listing Pending | 21 |
Listing Sold | 6 |
Listing Canceled | 6 |
The clearest message is that buyers are participating: the 21 moves to pending nearly matched the 20 new active and First Look entries. The 27 price reductions add another useful piece of the picture—sellers are adapting their prices as they look for the right buyer. For someone preparing to sell, that points to a practical approach: make your home inviting, price it thoughtfully and stay open to feedback.
A Look At September
Gig Harbor’s average sale price was $1,057,140 in September, down 3.1% from August’s $1,090,698 and up 13.6% from September 2025’s $930,873. An average adds up the prices of homes that sold and divides by the number of sales. It offers a useful view of the market, while nearby sales of homes like yours help bring that picture closer to home.
September 2026 Metric | Value |
|---|---|
Average Sales Price (Sold Homes) | $1,057,140 |
Closed Sales | 74 |
Homes For Sale | 273 |
Average Days On Market (Sold Homes) | 48 |
Months Supply (Closed) | 4.4 |
September saw 74 completed sales and 273 homes for sale. Homes that sold had spent an average of 48 days on the market. The 4.4 months of supply is an estimate of how long available homes would last at the report’s sales pace—not a prediction of how long your home will take to sell.
Mortgage Rates And Home Sale Prices
From August to September, the national 30-year mortgage rate averaged 6.86%, up from 6.67%, while Gig Harbor’s average sold price eased from $1,090,698 to $1,057,140. For buyers, that is a reminder to look at the monthly payment as well as the asking price. For sellers, it reinforces the value of pricing thoughtfully for today’s buyers. Over the full year shown, local average sale prices moved up and down while rates followed a steadier rise after February.
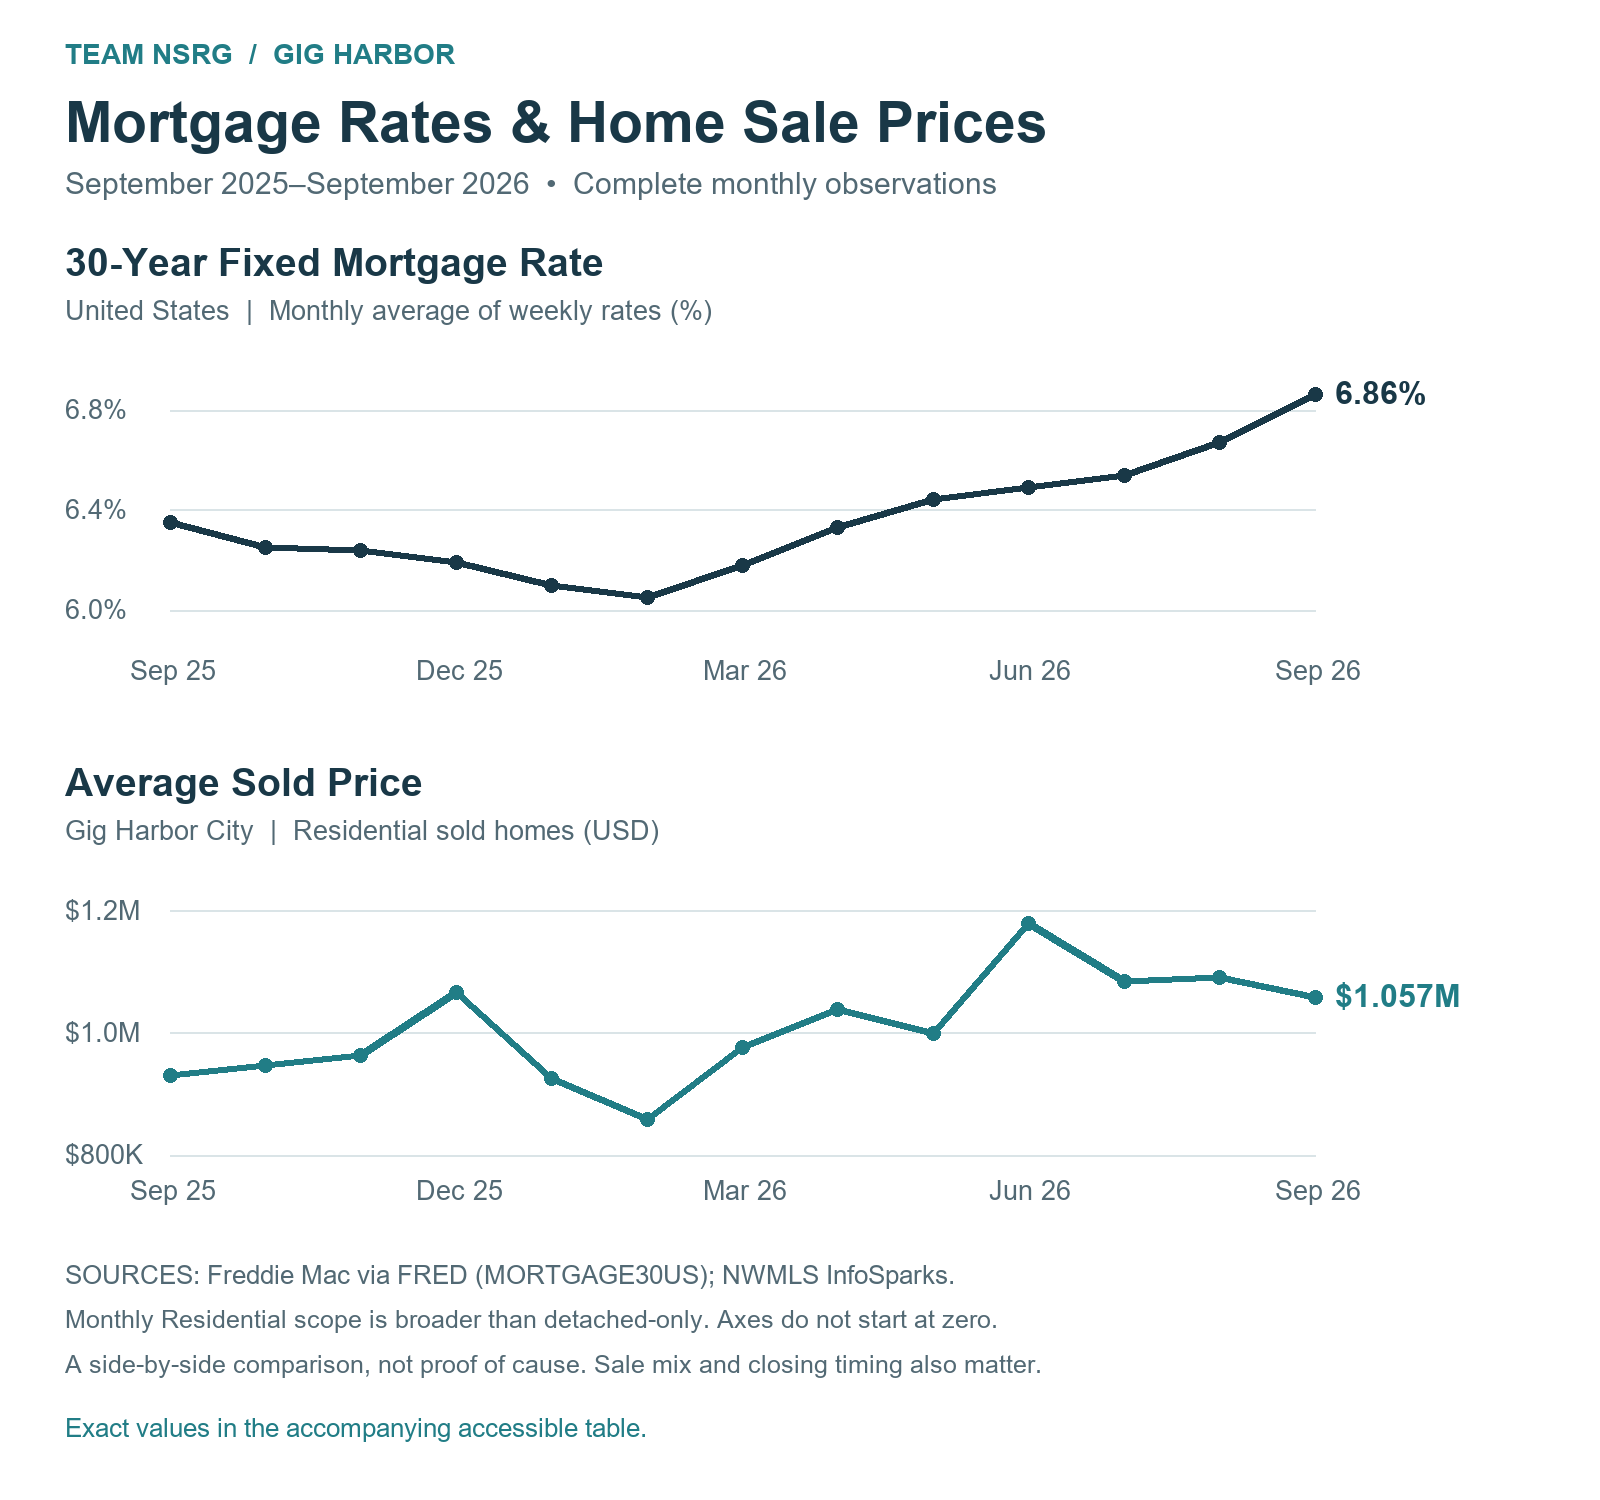
Open the full-size desktop chart · Open the larger-label mobile chart. Exact monthly values are listed below.
A Daily Look At Mortgage Rates
Mortgage News Daily’s 30-year fixed rate was 7.40% on October 20, 2026, down 0.03 percentage points from the previous daily reading. That small move is a useful reminder to check current financing costs as you compare homes. Ask your lender what today’s rate means for your monthly payment and whether a rate lock fits your timing.
Rate Snapshot — October 20, 2026
This is a dated summary, not a live feed. Daily changes below are in percentage points.
Loan Type | Rate And Daily Change |
|---|---|
30-Year Fixed | 7.40% |
15-Year Fixed | 7.05% |
30-Year Jumbo | 7.65% |
7/6 SOFR ARM | 6.80% |
30-Year FHA | 7.02% |
30-Year VA | 7.04% |
View Mortgage News Daily’s live rate dashboard
Explore MND’s daily rate movement and history
The monthly chart above helps you see the longer view; MND’s daily dashboard helps you follow more recent moves. They use different surveys and time periods, so their readings need not match. These national benchmarks are a starting point—your loan terms and qualifications determine your lender’s quote.
Average Sold Prices — Gig Harbor Residential
Month | Average Sold Price |
|---|---|
September 2025 | $930,873 |
October 2025 | $947,103 |
November 2025 | $963,423 |
December 2025 | $1,065,497 |
January 2026 | $925,572 |
February 2026 | $857,681 |
March 2026 | $975,370 |
April 2026 | $1,038,801 |
May 2026 | $999,030 |
June 2026 | $1,178,911 |
July 2026 | $1,084,249 |
August 2026 | $1,090,698 |
September 2026 | $1,057,140 |
Average 30-Year Mortgage Rates — United States
Month | Rate |
|---|---|
September 2025 | 6.35% |
October 2025 | 6.25% |
November 2025 | 6.24% |
December 2025 | 6.19% |
January 2026 | 6.10% |
February 2026 | 6.05% |
March 2026 | 6.18% |
April 2026 | 6.33% |
May 2026 | 6.44% |
June 2026 | 6.49% |
July 2026 | 6.54% |
August 2026 | 6.67% |
September 2026 | 6.86% |
Frequently Asked Questions
What should I take from the price reductions?
They show sellers adjusting their asking prices. For buyers, that makes a second look worthwhile when a home fits your plans. For sellers, it’s a reminder to compare your home honestly with nearby choices and respond to feedback. The goal is a price and presentation that give buyers a reason to act.
Does the higher average sale price mean my home is worth 13.6% more?
Not necessarily. Different homes sold in each period, and higher-priced sales can move the average. Recent sales of homes like yours are a better starting point for understanding your home’s value.
Where should I start if I’m thinking about moving?
Start with your budget, timing and the features that matter most to you. Then compare a few suitable homes—or recent nearby sales if you’re preparing to sell.
You don’t have to sort through the numbers alone. Jeremy Minor and Team NSRG can help you make sense of nearby listings and recent sales, with your plans in mind.
Click Below to View Listings
Browse Gig Harbor Residential Listings
The search includes a wider range of homes and uses different area boundaries from the weekly report.
Sources And Scope
Interpretation: Weekly counts are listing events and may overlap; they are not unique inventory or an absorption rate. No matching prior-week baseline is available. Pricing and preparation advice interprets overall activity; this report does not link individual price cuts to accepted offers or measure condition. The rate-price chart is descriptive: sale mix and the time between financing and closing also matter.
Daily rates: Mortgage News Daily, official rate dashboard, dated October 20, 2026; six product rates and previous-reading changes verified directly from the displayed source. Changes are percentage points. Static snapshot; linked dashboard and history update separately. This daily index is distinct from Freddie Mac/FRED monthly means.
Rates: Freddie Mac via FRED, MORTGAGE30US, United States, percent, not seasonally adjusted. Calendar-month means of weekly observations, rounded to two decimals; 56 weekly observations checked against all 13 monthly values. September 2025–September 2026 only; incomplete October excluded. Official FRED series.
Comparison limits: August 2026 and September 2025 figures are unavailable for completed sales, homes for sale, average selling time and months of supply. Changes from those periods are omitted. Sale prices and average days on market describe homes that sold; the monthly figures cover broader Residential homes. Months of supply uses the Closed sales series.
Weekly: NWMLS Matrix Market Watch, 7 Day view. Exact capture 2026-10-20T08:50:49.355-07:00 Pacific / 2026-10-20T15:50:49.355Z UTC. Displayed ChangeTypeHistory Modification Timestamp boundary 10/13/2026+. Exact clock boundaries unavailable; not a verified 168-hour interval. Washington; Pierce County; exact MLS City Gig Harbor; Single Family, Residential subtype; styles 10-18, 25 and 26; excluding Attached/Zero Lot Line and Incomplete. No map, area, community, ZIP, price, year-built, broker or office restrictions. MLS-coded detached-home proxy, not independent verification of municipal boundaries or physical property type. Events overlap; Active events are not inventory.
Monthly: NWMLS InfoSparks, Gig Harbor (City), Residential, Monthly; 1 Year chart rendered January 2025-September 2026, captured price trend September 2025-September 2026. All price ranges, bedrooms, lot sizes, construction types, styles, square footage, waterfront properties and transaction sides. Broader Residential is not detached-only. Price and DOM concern sold homes; supply uses Closed series. Price values read from exact visible tooltips, not chart geometry. Price comparisons rounded to one decimal; statistics may be revised.
Average-price series verified from visible InfoSparks tooltips; saved October 20, 2026 at approximately 6:09 PM Pacific / October 21, 2026 01:09 UTC. September summary records: Months Supply checkpoint 2026-10-20T11:42:02.2946052-07:00 Pacific (18:42:02.2946052 UTC); Closed Sales checkpoint 2026-10-20T11:43:33.7646613-07:00 Pacific (18:43:33.7646613 UTC); Homes For Sale capture 2026-10-20T11:49:56.4274524-07:00 Pacific (18:49:56.4274524 UTC); Average DOM capture 2026-10-20T11:50:27.5674249-07:00 Pacific / 2026-10-20T18:50:27.5674249+00:00 UTC. A checkpoint time records when the value was saved and may differ from the exact observation time. Historical comparisons for these four metrics were unavailable while the charts were loading.