
Buyers are still making moves in Edmonds, with plenty to compare. The October 20 report recorded eight moves to pending—homes going under contract—alongside 17 new active listings and two First Look listings. Those 19 fresh entries outnumbered pending activity in this snapshot. Another 17 price reductions show sellers adapting. The takeaway: buyers have choices, and a well-presented home with a thoughtful asking price has a clearer chance to earn their attention.
For Buyers: Use the choices available to compare carefully. Revisit suitable homes after price changes, weigh condition and location, and decide what works for your payment budget before making an offer.
For Sellers: Give buyers a clear reason to choose your home. Tackle noticeable repairs, make the home easy to show and price against nearby alternatives. The eight pending events show buyers are acting, even as new listings compete for their attention.
Recent Listing Activity
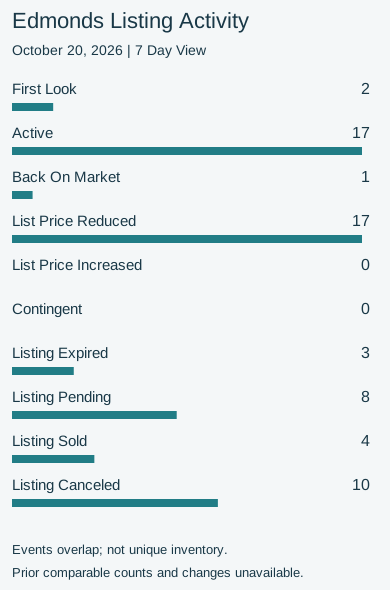
The October 20 NWMLS 7 Day view recorded 17 price-reduction events and 8 pending events. Categories can overlap and do not count unique available homes.
Event | Count |
|---|---|
First Look | 2 |
Active | 17 |
Back On Market | 1 |
List Price Reduced | 17 |
List Price Increased | 0 |
Contingent | 0 |
Listing Expired | 3 |
Listing Pending | 8 |
Listing Sold | 4 |
Listing Canceled | 10 |
No validated adjacent, non-overlapping prior-week baseline is available. Prior counts and absolute/percentage changes are unavailable, not zero. No true week-over-week change is claimed.
September Market Context
Edmonds’ average sold price was $1,260,032 in September, up 4.1% from August’s $1,210,533 and up 19.8% from September 2025’s $1,051,586. An average adds up the prices of homes that sold and divides by the number of sales. Different homes sell each month, so nearby sales of homes like yours are a better guide to an individual property’s value.
September brought 46 completed sales and 180 homes for sale. Homes that sold spent an average of 30 days on the market. More homes were available than in August or a year earlier, giving buyers more to compare and making a thoughtful asking price especially useful for sellers.
Months of supply estimates how long available homes would last at the report’s sales pace. It does not predict how long your home will take to sell.
Average Sales Price
Period / Change | Value |
|---|---|
Sep 2025 | $1,051,586 |
Aug 2026 | $1,210,533 |
Sep 2026 | $1,260,032 |
MoM | +4.1% |
YoY | +19.8% |
Closed Sales
Period / Change | Value |
|---|---|
Sep 2025 | 52 |
Aug 2026 | 52 |
Sep 2026 | 46 |
MoM | -11.5% |
YoY | -11.5% |
Homes For Sale
Period / Change | Value |
|---|---|
Sep 2025 | 101 |
Aug 2026 | 157 |
Sep 2026 | 180 |
MoM | +14.6% |
YoY | +78.2% |
Average Days On Market (Sold Homes)
Period / Change | Value |
|---|---|
Sep 2025 | 35 |
Aug 2026 | 24 |
Sep 2026 | 30 |
MoM | +25.0% |
YoY | -14.3% |
Months Supply (Closed)
Period / Change | Value |
|---|---|
Sep 2025 | 2.0 |
Aug 2026 | 3.3 |
Sep 2026 | 3.9 |
MoM | +18.2% |
YoY | +95.0% |
Mortgage Rates And Home Sale Prices
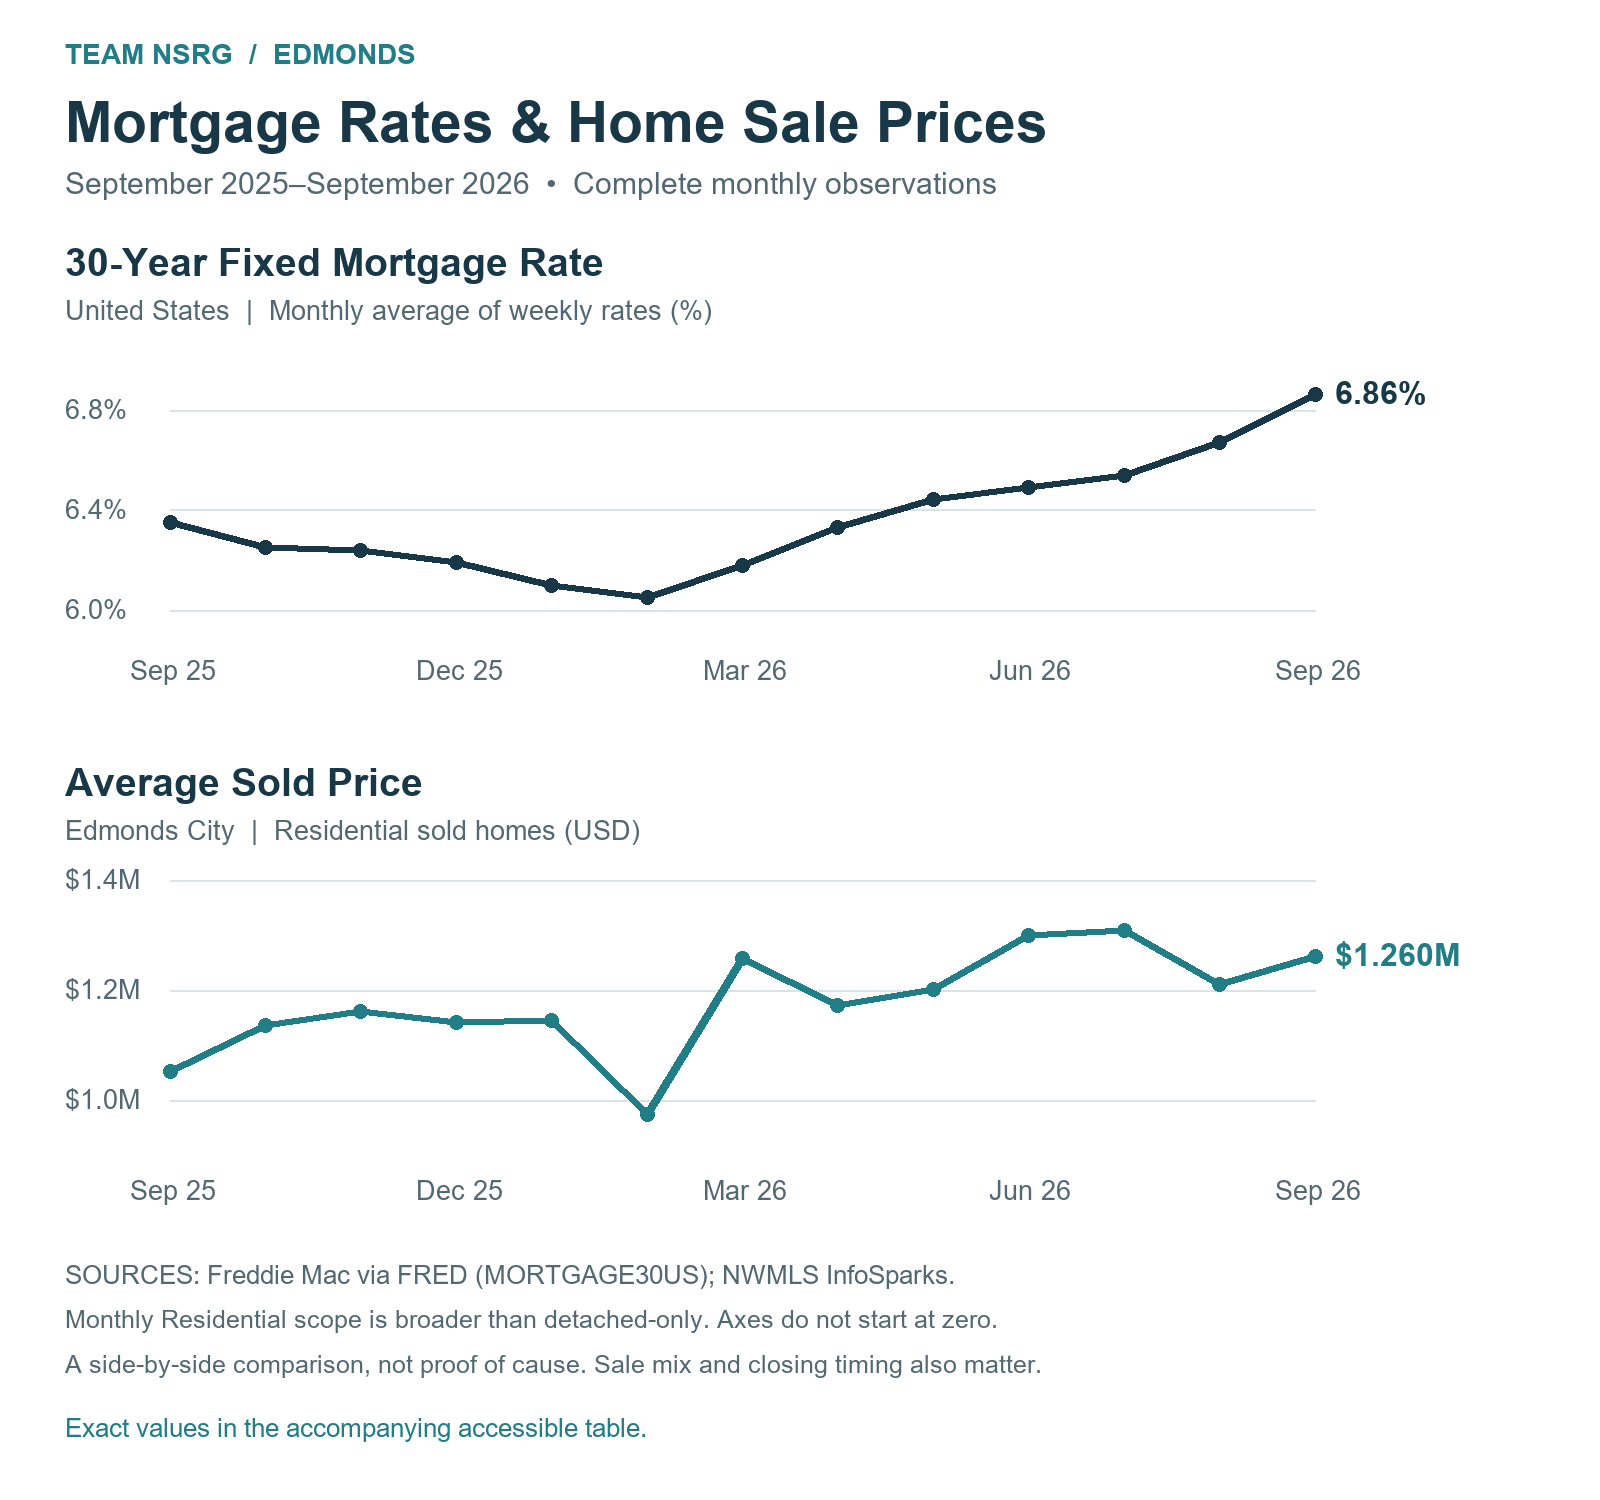
From August to September, the national 30-year mortgage rate averaged 6.86%, up from 6.67%, while Edmonds’ average sold price rose from $1,210,533 to $1,260,032. That combination makes the monthly payment especially important when comparing homes. Sellers can help buyers see the value in their price and presentation.
Open the full-size desktop chart · Open the larger-label mobile chart
A Daily Look At Mortgage Rates
Mortgage News Daily’s 30-year fixed rate was 7.40% on October 20, 2026, down 0.03 percentage points from its previous daily reading. Check current financing costs as you compare homes, and ask your lender what today’s rate means for your payment and rate-lock timing.
Rate Snapshot — October 20, 2026
This is a dated summary, not a live feed. Daily changes are in percentage points.
Loan Type | Rate And Daily Change |
|---|---|
30-Year Fixed | 7.40% · Down 0.03 |
15-Year Fixed | 7.05% · Down 0.02 |
30-Year Jumbo | 7.65% · Unchanged (0.00) |
7/6 SOFR ARM | 6.80% · Down 0.01 |
30-Year FHA | 7.02% · Down 0.02 |
30-Year VA | 7.04% · Down 0.01 |
View Mortgage News Daily’s live rate dashboard
Explore MND’s daily rate movement and history
The monthly chart shows the longer view; MND’s daily dashboard follows more recent moves. They use different surveys and time periods, so readings need not match. Your loan terms and qualifications determine your lender’s quote.
Average 30-Year Mortgage Rates — United States
Month | Rate |
|---|---|
September 2025 | 6.35% |
October 2025 | 6.25% |
November 2025 | 6.24% |
December 2025 | 6.19% |
January 2026 | 6.10% |
February 2026 | 6.05% |
March 2026 | 6.18% |
April 2026 | 6.33% |
May 2026 | 6.44% |
June 2026 | 6.49% |
July 2026 | 6.54% |
August 2026 | 6.67% |
September 2026 | 6.86% |
Average Sold Prices — Edmonds Residential
Month | Average Sale Price |
|---|---|
September 2025 | $1,051,586 |
October 2025 | $1,134,880 |
November 2025 | $1,160,976 |
December 2025 | $1,141,431 |
January 2026 | $1,144,795 |
February 2026 | $972,937 |
March 2026 | $1,258,178 |
April 2026 | $1,171,277 |
May 2026 | $1,201,481 |
June 2026 | $1,299,162 |
July 2026 | $1,309,000 |
August 2026 | $1,210,533 |
September 2026 | $1,260,032 |
Frequently Asked Questions
What should I take from the price reductions?
Sellers are adjusting their asking prices. Revisit a home if the new price fits your plans; if you are selling, compare your home honestly with nearby choices and respond to feedback.
Does the average price change tell me what my home is worth?
No single citywide figure can do that. The mix of homes sold changes, and a few expensive sales can move the average. Recent sales of homes similar to yours are the better starting point.
Where should I start?
Start with your budget, timing and the features that matter most. Jeremy Minor and Team NSRG can help you compare suitable listings and nearby sales with your plans in mind.
Click Below to View Listings
Browse Edmonds Residential Listings
Live website search uses broader Residential and its own geographic boundary; it does not reproduce the detached-home event filters above.
Sources And Scope
Weekly: NWMLS Matrix Market Watch, 7 Day view. Exact capture 2026-10-20T08:49:13.274-07:00 Pacific / 2026-10-20T15:49:13.274Z UTC. Displayed ChangeTypeHistory Modification Timestamp boundary 10/13/2026+. Exact clock boundaries unavailable; not a verified 168-hour interval. Washington; Snohomish County; exact MLS City Edmonds; Single Family, Residential subtype; styles 10-18, 25 and 26; exclude Attached/Zero Lot Line and Incomplete. No map, area, community, ZIP, price, year-built, broker or office restrictions. MLS-coded detached-home proxy, not independent verification of municipal boundaries or physical property type. Events overlap; Active events are not inventory.
Monthly: NWMLS InfoSparks, Edmonds (City), Residential, Monthly, 1 Year chart rendered January 2025-September 2026; captured trend September 2025-September 2026. All price ranges, bedrooms, lot sizes, construction types, styles, square footage, waterfront properties and transaction sides. Broader Residential is not detached-only. Price and DOM concern sold homes; supply uses Closed series. Values read from exact visible tooltips. MoM compares August 2026; YoY September 2025, rounded to one decimal. Statistics may be revised.
Other captures on October 20, 2026, September 2025 / August 2026 / September 2026 order. Closed Sales UTC: 18:38:18.356Z; 18:38:19.349Z; 18:38:20.357Z (Pacific 11:38:18.356; 11:38:19.349; 11:38:20.357, UTC-07:00). Homes For Sale UTC: 18:38:30.528Z; 18:38:31.536Z; 18:38:32.535Z (Pacific 11:38:30.528; 11:38:31.536; 11:38:32.535, UTC-07:00). Average DOM UTC: 18:39:38.073Z; 18:39:39.071Z; 18:39:40.071Z (Pacific 11:39:38.073; 11:39:39.071; 11:39:40.071, UTC-07:00). Months Supply UTC: 18:39:57.008Z; 18:39:58.010Z; 18:39:59.011Z (Pacific 11:39:57.008; 11:39:58.010; 11:39:59.011, UTC-07:00).
Average-price series: exact visible InfoSparks date/value tooltips captured October 21, 2026, 02:36:06.672–02:36:15.950 UTC / October 20, 2026, 19:36:06.672–19:36:15.950 Pacific (UTC−07:00). Residential, Monthly; all filters unchanged. Chart range 1 Year rendered January 2025–September 2026; captured September 2025–September 2026.
Weekly events may overlap and are not unique inventory or an absorption rate. No matching adjacent prior-week baseline is available. Pricing and preparation advice interprets overall activity; it does not link individual price cuts to accepted offers or measure condition.
Rates: Freddie Mac via FRED MORTGAGE30US, United States, percent, not seasonally adjusted. Calendar-month means of weekly observations, rounded to two decimals; 56 weekly observations checked against all 13 monthly means. September 2025–September 2026; incomplete October excluded. Rate-price comparison is descriptive, not proof of cause; sale mix and financing-to-closing timing also matter.
Daily rates: Mortgage News Daily official dashboard, dated October 20, 2026. Changes are percentage points from the previous daily reading. Static snapshot; linked dashboard and history update separately. This daily survey differs from the FRED monthly series.