Team NSRG | October 25, 2026 | By Jeremy Minor

City of Snohomish buyers have more selection, while sellers are competing for fewer completed sales than a year ago. Average sold-home price has held close to last September’s level, so this is not a simple story of prices falling everywhere. My read is that a home’s condition, setting and asking price matter more than a broad citywide headline.
What buyers and sellers can take from this
For buyers: Use the wider selection to compare homes carefully. Check how the asking price stacks up against recent comparable sales and the other homes you could buy.
For sellers: Show buyers why your home deserves their attention. More homes for sale and fewer closings make preparation and a defensible price especially useful.
The latest seven-day view
The latest snapshot recorded 10 pending events and 9 sold events, matching the October 18 report. Active events fell from 22 to 11 and price reductions from 22 to 14. Buyer activity continued even as the flow of Active events slowed in these two report snapshots.
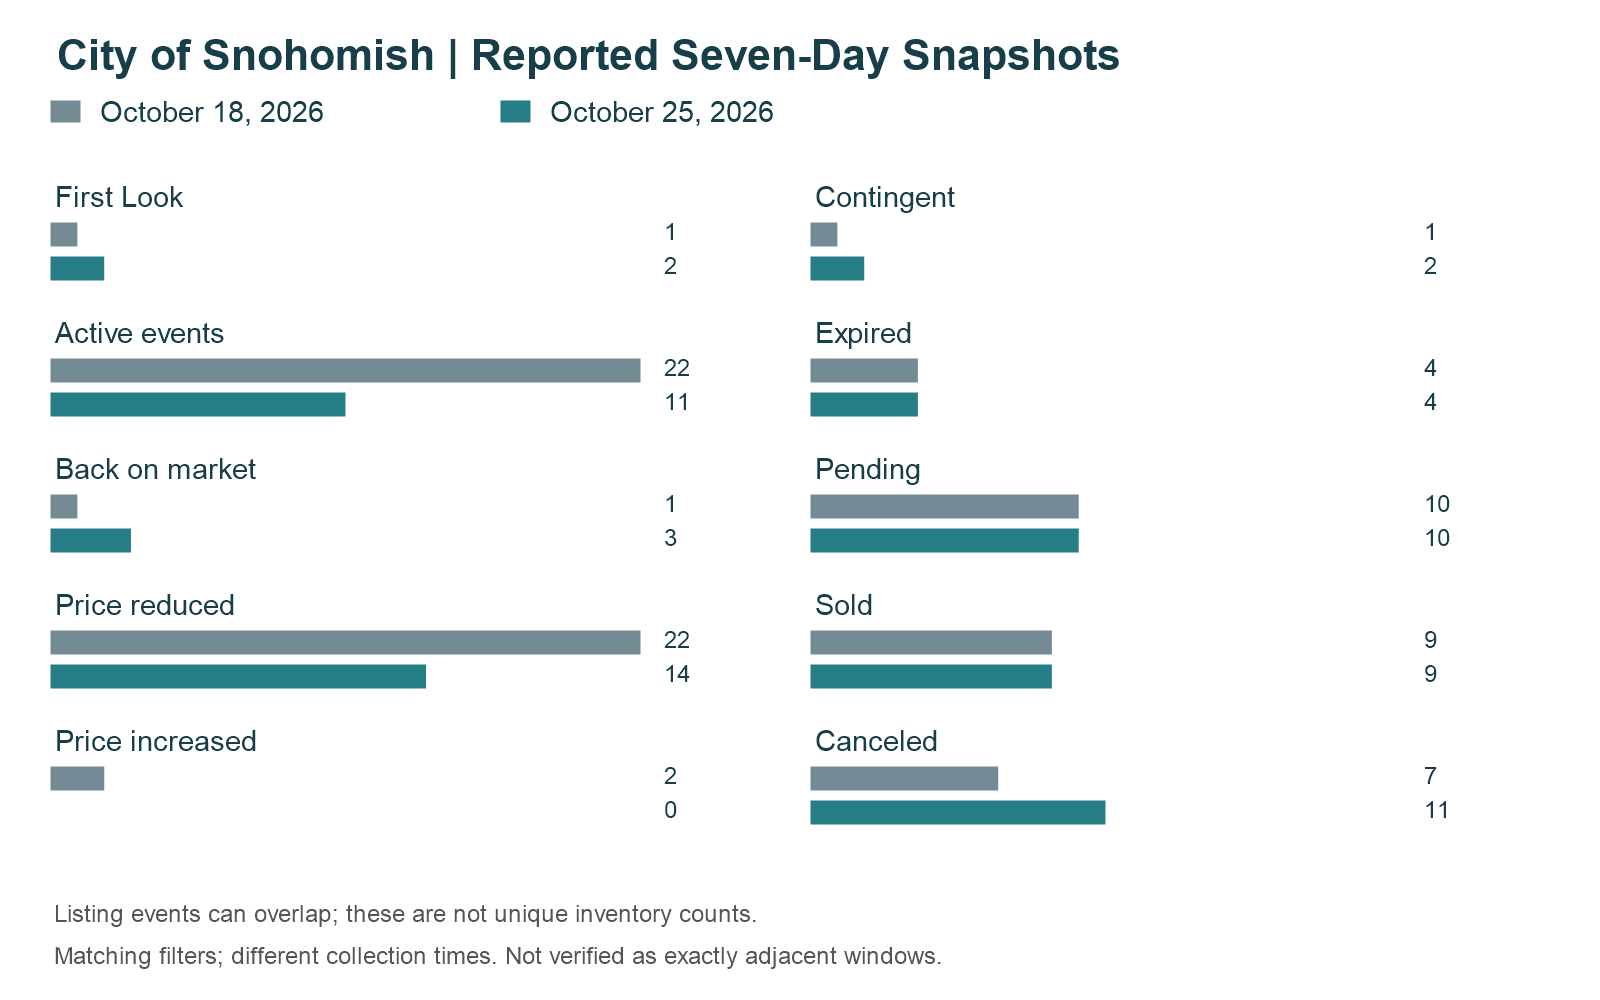
October 18 and October 25 are saved report snapshots collected at different times. This is a previous-report comparison, not a verified comparison of adjacent seven-day periods. Listing events overlap and are not unique inventory counts.
September: more context for the decision
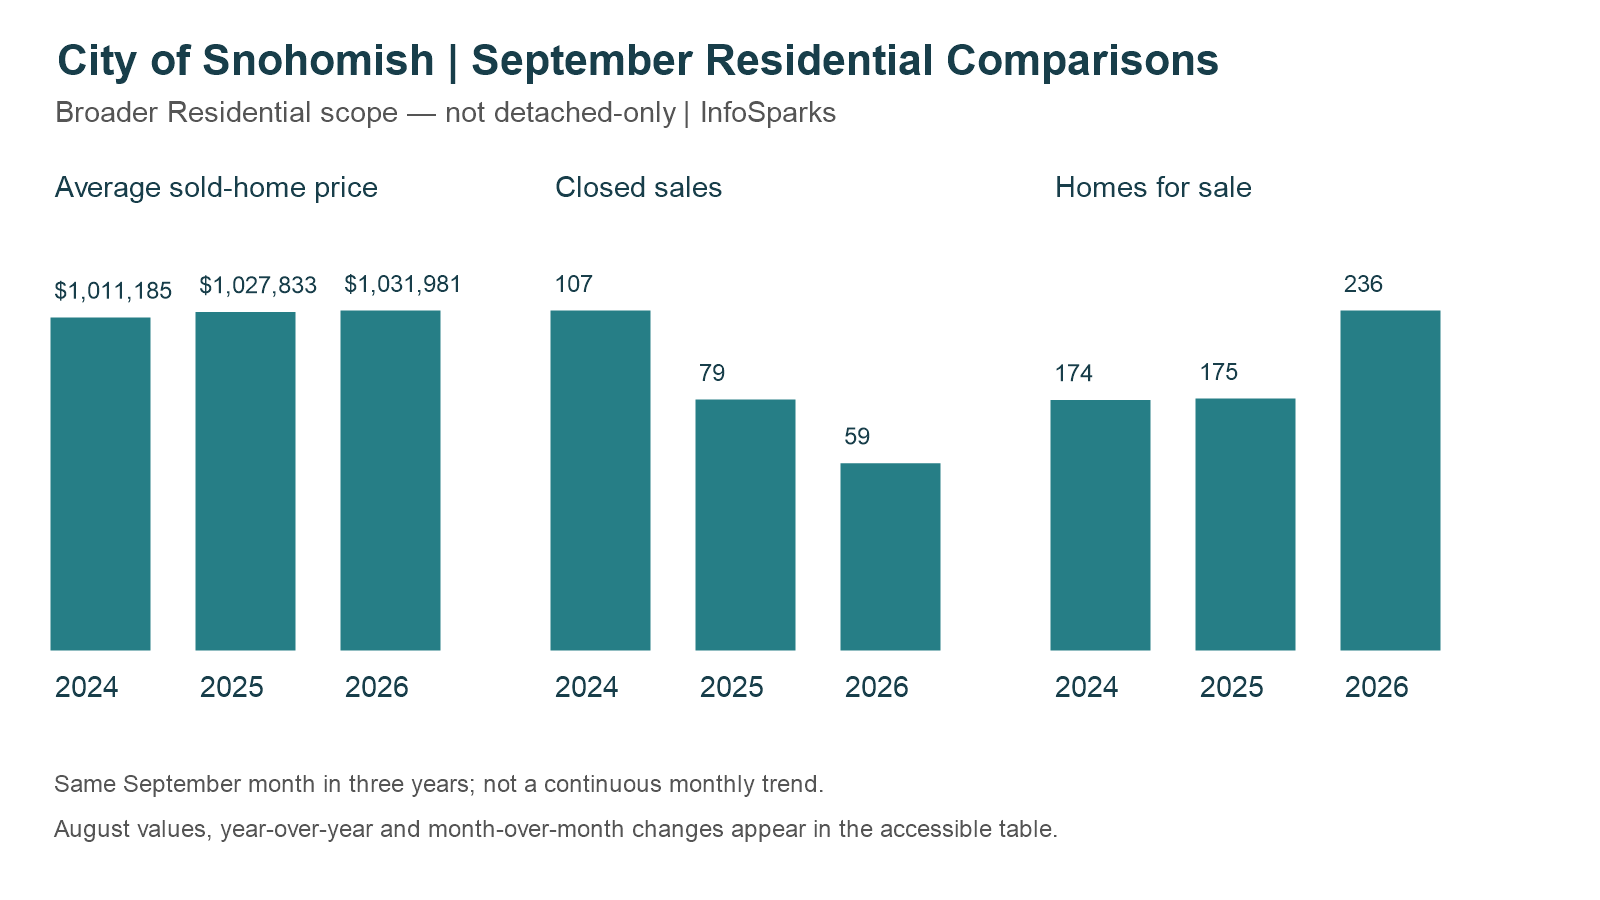
In the broader Residential series, September homes for sale rose 34.9% year over year, while closed sales fell 25.3%. Average sold-home price was almost flat, up 0.4% from a year earlier and 3.9% from August. Together, those figures suggest more choice and a selective market, rather than a uniform price direction across every neighborhood or home type.
Monthly figures cover broader Residential homes, not detached-only. Average prices also reflect the mix of homes sold and do not measure the appreciation of an individual home.
Rates and the monthly payment
Price is only one part of affordability. The national 30-year fixed weekly survey averaged 6.67% in August and 6.86% in September. Compare the payment for the particular home and financing available to you; these national series do not establish why local prices changed.
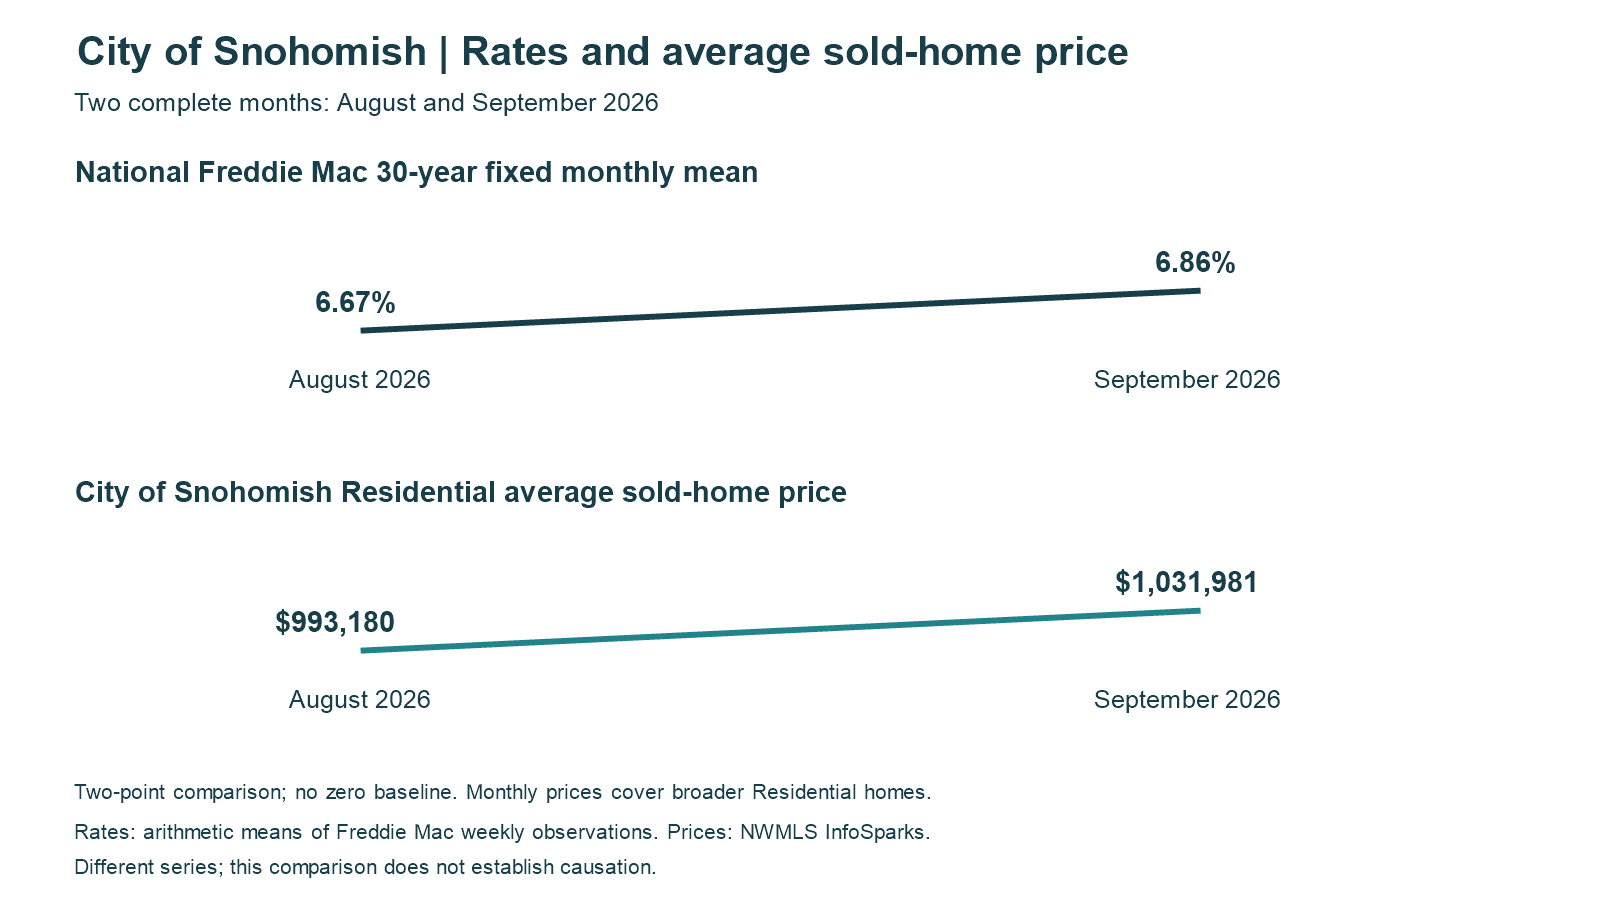
Two complete months, not a sustained trend. Rates are arithmetic means calculated from Freddie Mac weekly observations. The price series is broader Residential.
Mortgage-rate snapshot: October 23, 2026
The latest dated Mortgage News Daily observation checked for this report was October 23. These national index readings are context, not a lender quote or live widget. MND’s daily index uses a different methodology from Freddie Mac’s weekly survey and the monthly means above; these series are not interchangeable.
Loan type | Rate | Daily change (percentage points) |
|---|---|---|
30-year fixed | 7.33% | +0.03 |
15-year fixed | 6.98% | +0.02 |
30-year jumbo | 7.60% | 0.00 |
7/6 SOFR ARM | 6.75% | -0.03 |
30-year FHA | 6.98% | +0.06 |
30-year VA | 6.99% | +0.05 |
Current Mortgage News Daily rate page | Daily rate movement and methodology
The numbers behind the update
Listing event | October 18 report | October 25 report | Change | Change % |
|---|---|---|---|---|
First Look | 1 | 2 | +1 | +100.0% |
Active events | 22 | 11 | -11 | -50.0% |
Back on market | 1 | 3 | +2 | +200.0% |
Price reduced | 22 | 14 | -8 | -36.4% |
Price increased | 2 | 0 | -2 | -100.0% |
Contingent | 1 | 2 | +1 | +100.0% |
Expired | 4 | 4 | +0 | +0.0% |
Pending | 10 | 10 | +0 | +0.0% |
Sold | 9 | 9 | +0 | +0.0% |
Canceled | 7 | 11 | +4 | +57.1% |
Period | Average sold-home price |
|---|---|
September 2024 | $1,011,185 |
September 2025 | $1,027,833 |
August 2026 | $993,180 |
September 2026 | $1,031,981 |
Year over year | +0.4% |
Month over month | +3.9% |
Period | Closed sales |
|---|---|
September 2024 | 107 |
September 2025 | 79 |
August 2026 | 62 |
September 2026 | 59 |
Year over year | -25.3% |
Month over month | -4.8% |
Period | Homes for sale |
|---|---|
September 2024 | 174 |
September 2025 | 175 |
August 2026 | 225 |
September 2026 | 236 |
Year over year | +34.9% |
Month over month | +4.9% |
Month | National 30-year fixed mean |
|---|---|
August 2026 | 6.6675% (6.67% displayed) |
September 2026 | 6.8625% (6.86% displayed) |
Click Below to View Listings
Selected matching Active-event listings:
4826 113th Avenue SE | MLS 2597506
10201 133rd Place SE | MLS 2594612
19104 Waverly Dr | MLS 2589850
11914 152nd Place SE | MLS 2596440
3832 113th Dr SE | MLS 2596621
8110 151st Place SE | MLS 2596351
12827 173rd Dr SE | MLS 2595980
First Look Listings
These are the dated NWMLS First Look records observed October 25, 2026. Verified public Redfin pages are used where matching current Team NSRG pages were unavailable. Public status can change and is not guaranteed to remain First Look.
507 N Lake Roesiger | MLS 2578409
18025 59th Avenue SE | MLS 2596940
Your next move
The City of Snohomish calls for a home-by-home approach. Buyers have more to compare, and sellers have good reason to make their home’s value clear. If you are planning a move, I am happy to help you sort through the choices and put these numbers in context. - Jeremy
Sources and scope
NWMLS Market Watch collected October 25, 2026 at 8:33:56.402 a.m. PDT (2026-10-25T15:33:56.402Z). Washington, Snohomish County, MLS City Snohomish; Residential styles 10–18, 25 and 26; excludes Attached/Zero Lot Line and Incomplete; all prices, no map restriction. This is an MLS-coded detached-home proxy, not an independent construction audit. MLS City geography is not a verified municipal-boundary filter. Snohomish City-field results include places such as Clearview and Lake Roesiger; this is not a Snohomish County market report.
Source view: 7 Day. Active queries displayed October 18, 2026 onward through collection. Exact cutoff clock times and source query timezone were not shown; other event queries were not all individually boundary-checked. The prior report used October 11 onward and was collected October 18 at 6:33:11.282 p.m. PDT. Exact adjacent, nonoverlapping 168-hour coverage is unverified. Active events can include status transitions and are not necessarily first-ever listings.
InfoSparks observed October 25, 2026 in the morning PDT; city selection Snohomish CITY, Residential, other filters unrestricted. September is the latest complete month. October is excluded. Percent changes are calculated from displayed values, rounded to one decimal. Source figures can be revised.
NWMLS Market Watch | InfoSparks (member sources) | Freddie Mac weekly archive | FRED series definition. Monthly rate means were calculated from official weekly observations, not a downloaded FRED monthly export. Public listing status can change after verification.