Illustrated riverside town with a steel bridge and a beaver floating on a log.

City of Snohomish Detached Home Market Update for November 1, 2026

Team NSRG | November 1, 2026 | By Jeremy Minor

City of Snohomish undated branded detached single-family home banner

There is room for a thoughtful conversation in the City of Snohomish, but I wouldn’t assume every seller is in the same position. Understanding the home’s competition and the seller’s plans can help a buyer put together a compelling offer. If you’re selling, I’d consider possible concessions alongside the asking price, especially when buyers have similar homes to choose from.

This update follows the MLS “Snohomish” market area, which includes places such as Lake Roesiger outside the city limits. Weekly figures use an established detached-home filter proxy; monthly figures cover broader Residential homes.

The latest report snapshot

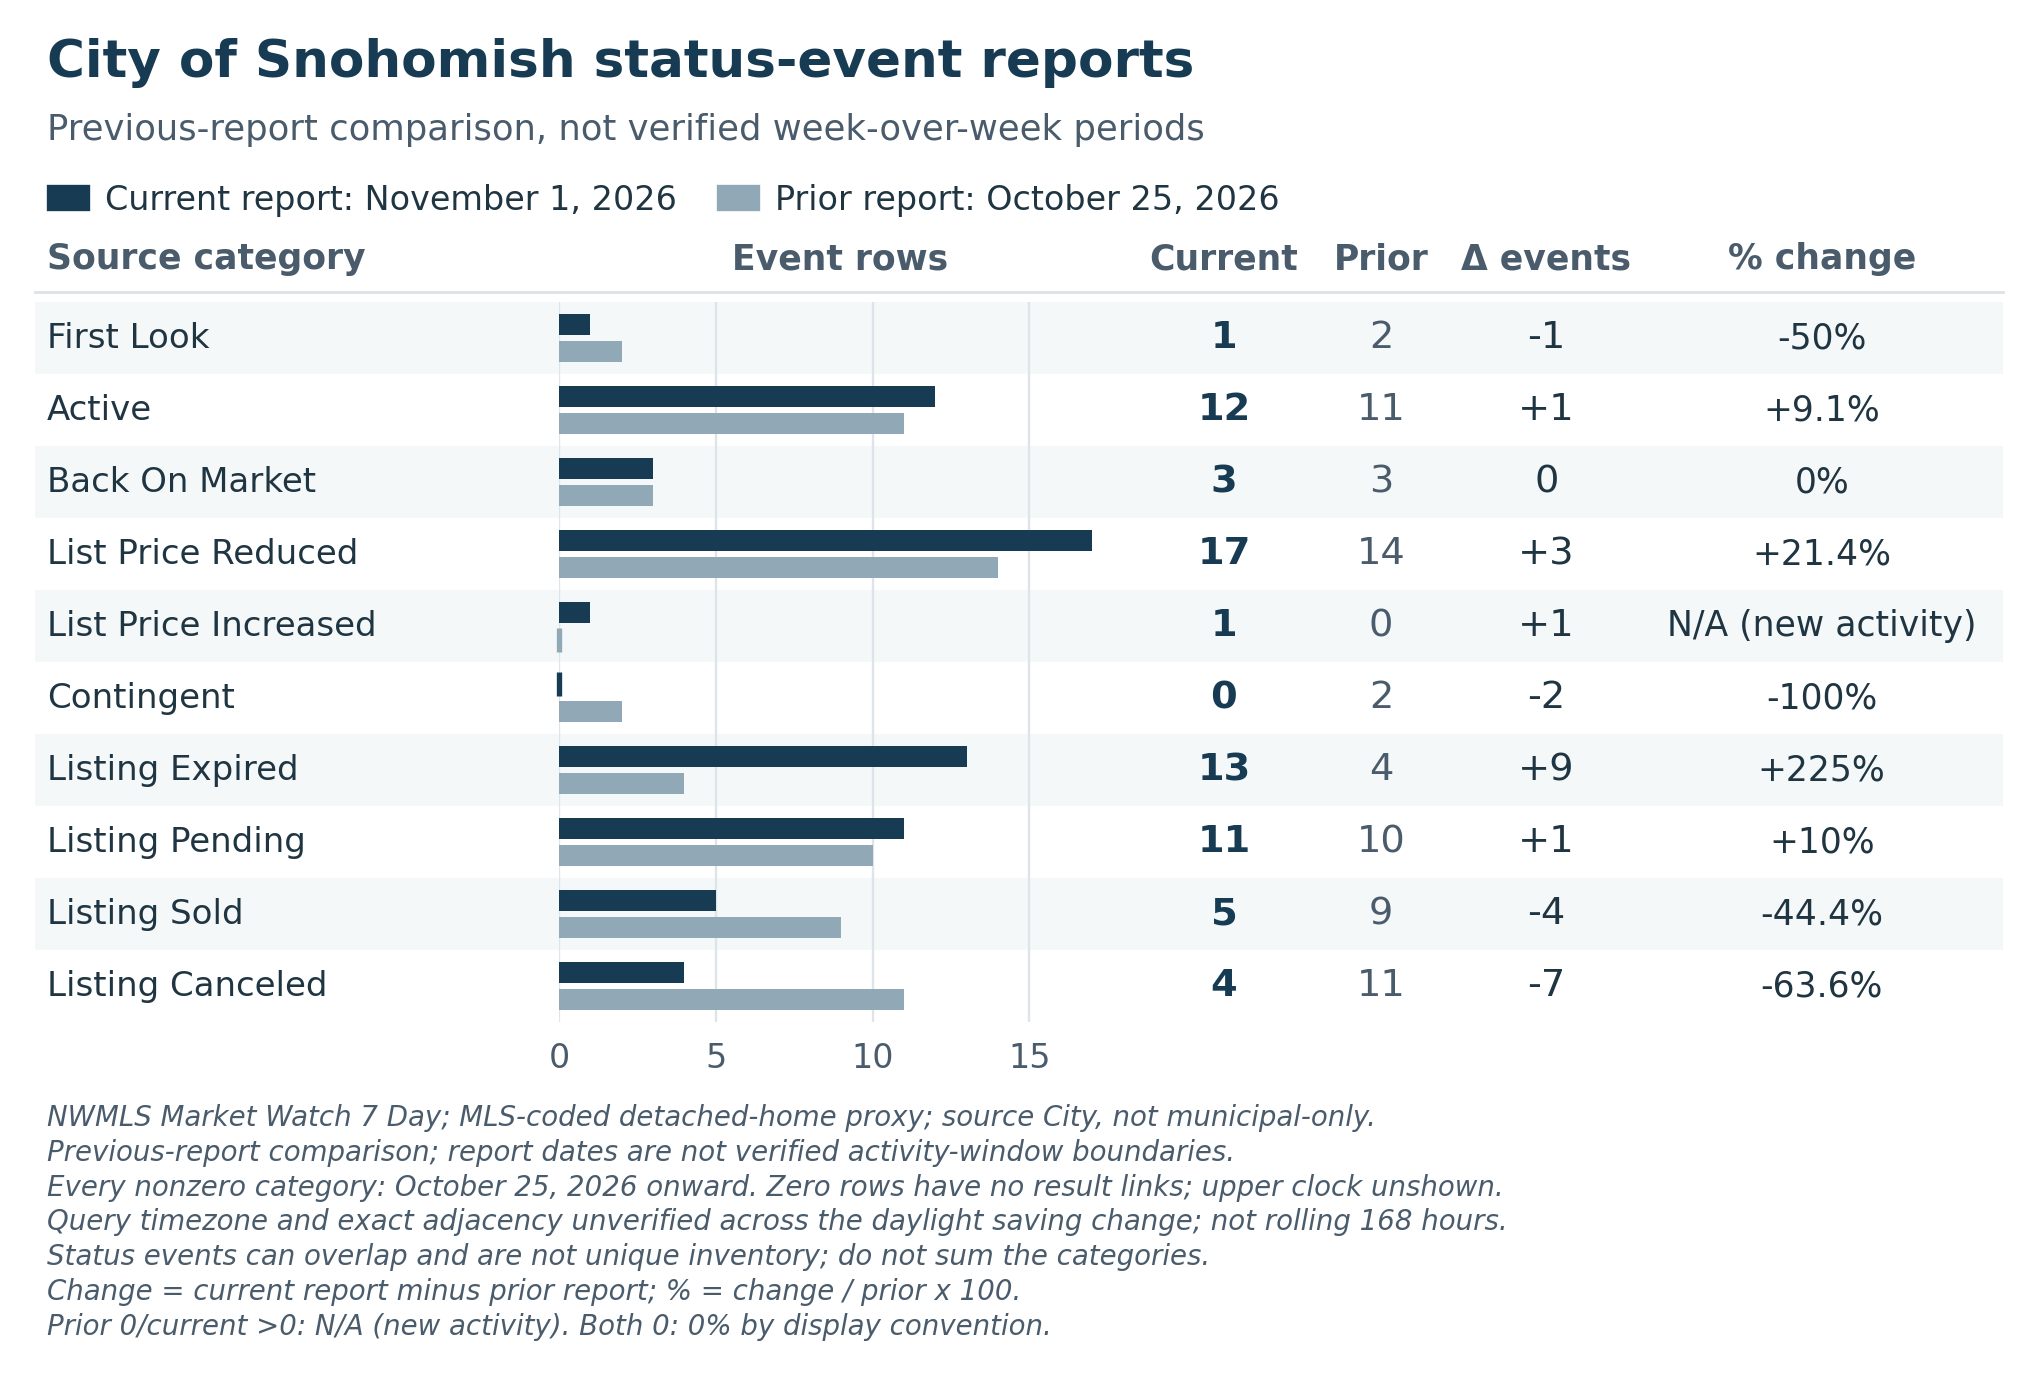
The latest report has more price reductions, but the activity is not moving in one direction. I’d use the short snapshot to decide what to look at more closely rather than to predict the next week.

City of Snohomish November 1 versus October 25 report event counts and changes

Open the full-size weekly graphic | Read the exact counts and changes

Previous-report comparison, not verified adjacent seven-day windows. Status events overlap and are not unique inventory.

October context for your plans

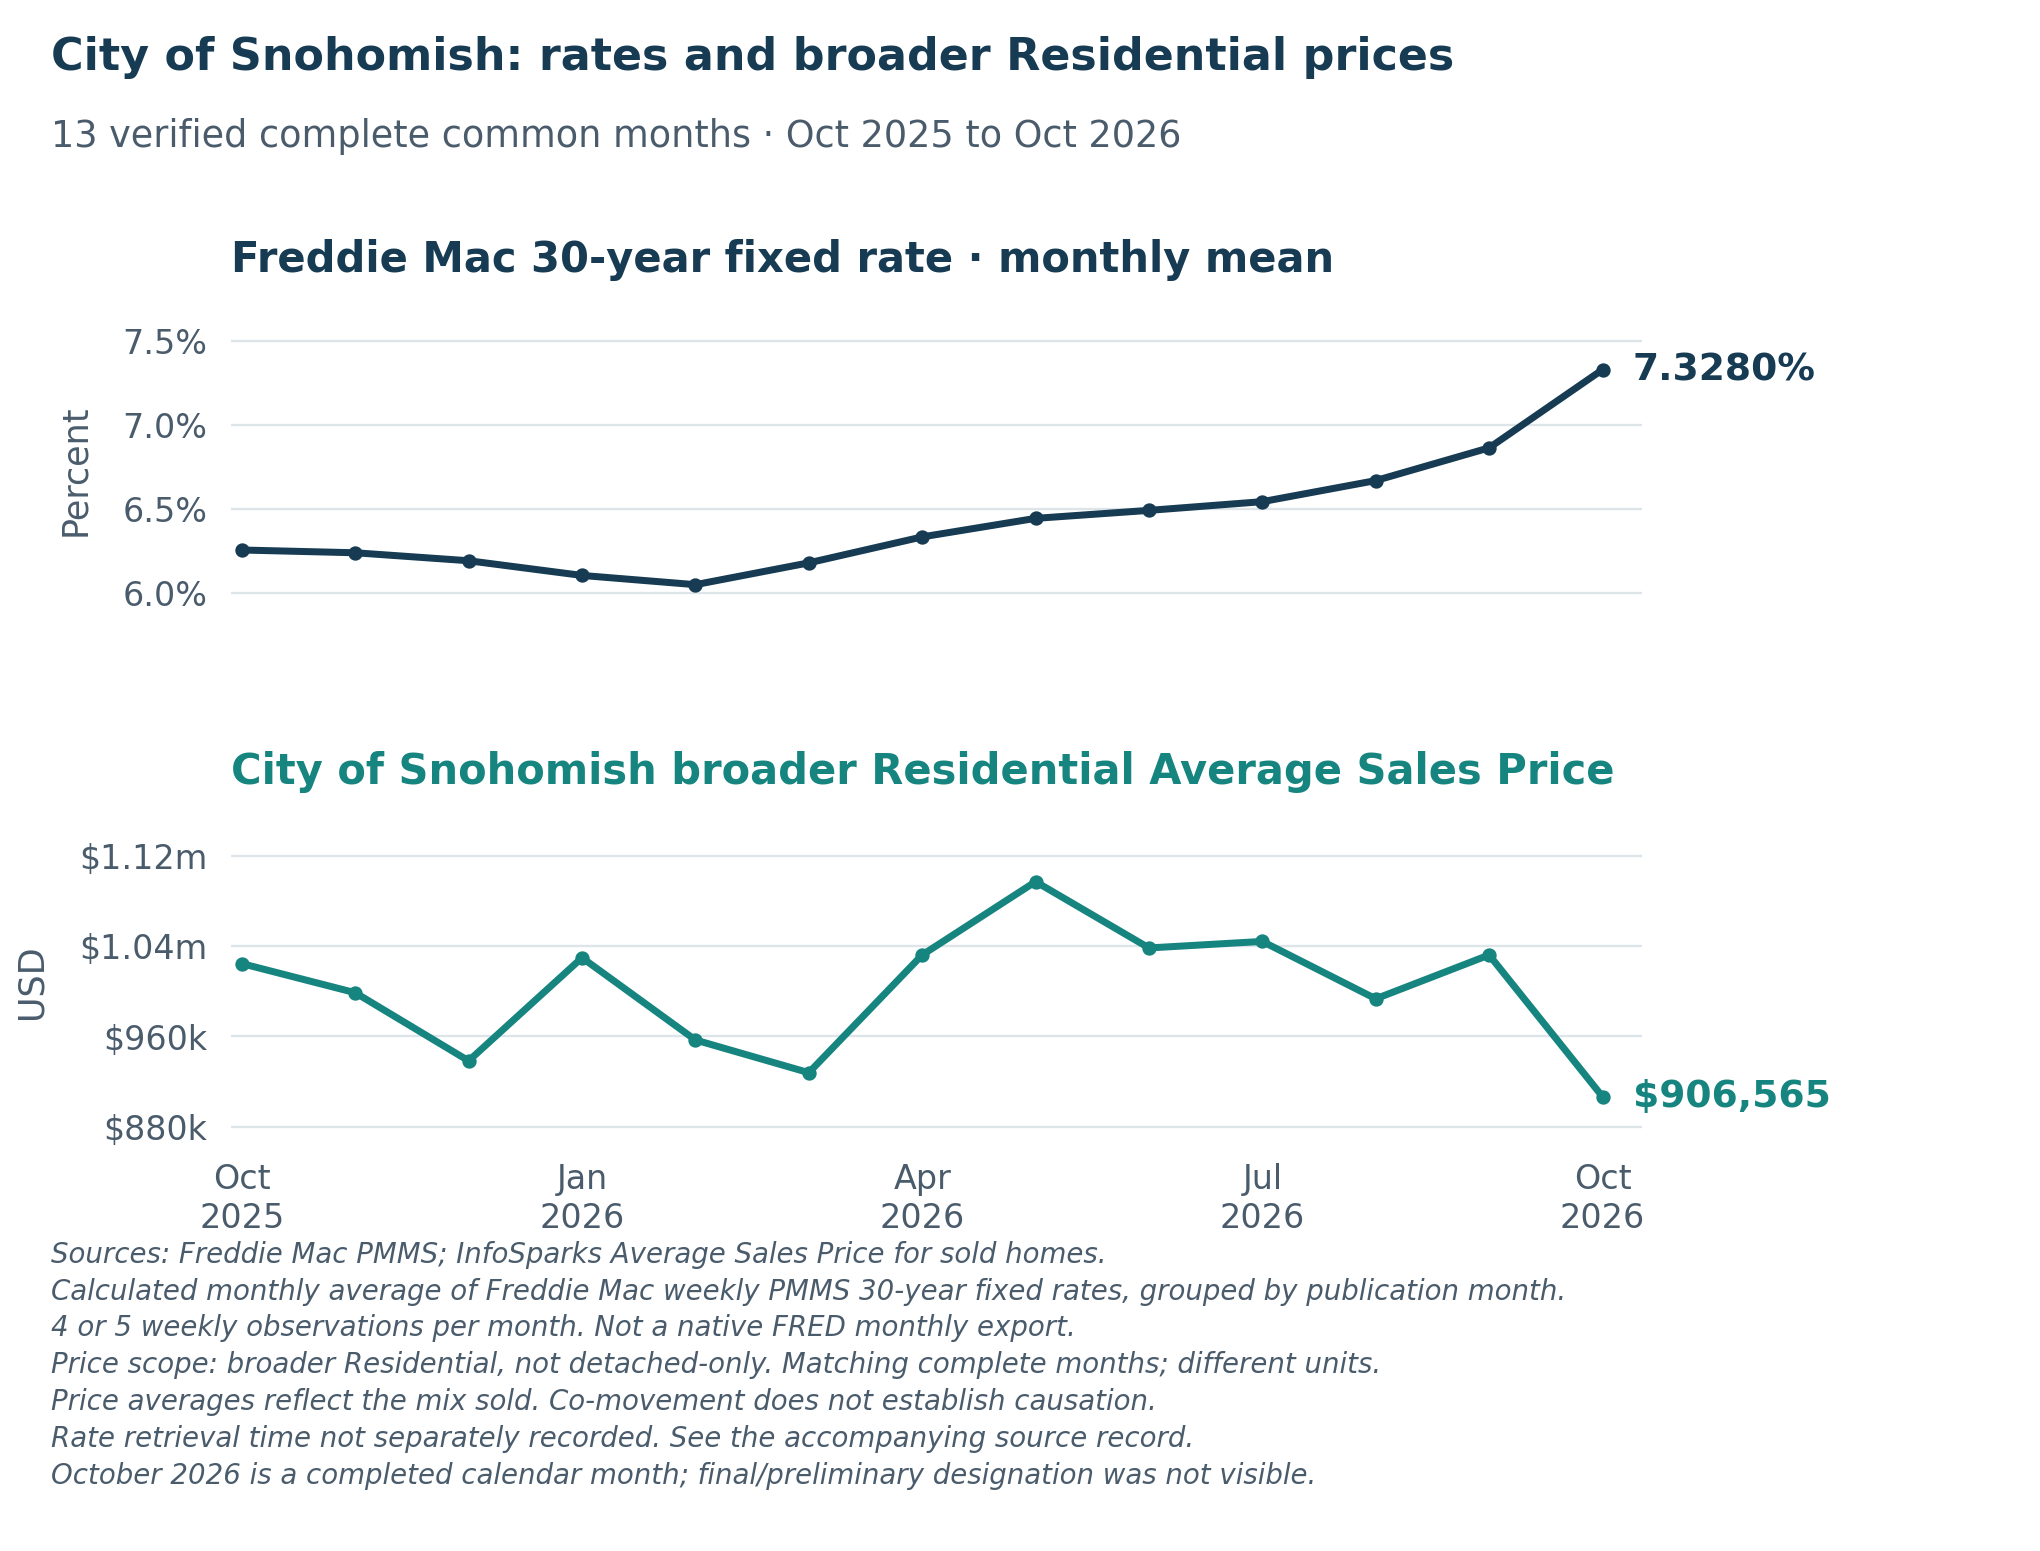
October’s sold-price average is lower, while marketing time is similar to the comparison months. I’d take that as a reminder to look closely at which homes sold, not assume that every property lost the same amount of value.

Before getting too attached to an asking price, it can help to talk through how the monthly payment fits your plans.

City of Snohomish average Residential sales price and calculated national Freddie Mac monthly rate panels

Open the full-size monthly graphic | Read the exact monthly values

Mortgage-rate snapshot: October 30, 2026

Product

Rate

Daily change

30-year fixed

7.27%

−0.02 percentage points

A static snapshot, not a live widget or personalized quote. MND’s daily methodology differs from the monthly Freddie Mac series above.

View live Mortgage News Daily rates | View daily rate movement

Click Below to View Listings

First Look example: 1330 S Lake Roesiger Road | MLS 2598382 (Redfin)*

Selected dated-event examples, not an exhaustive inventory. Public availability can change.

*Exact-match external First Look fallback; the source event and public status were checked separately.

If you’re considering a move in the City of Snohomish area, let’s talk about what you’re hoping to accomplish and what comes next. Jeremy Minor, Team NSRG.

Contact Jeremy | Email | Call | Book a conversation

The numbers behind the update

Status event

November 1 report

October 25 report

Change

Change %

First Look

1

2

−1

−50%

Active

12

11

+1

+9.1%

Back On Market

3

3

0

0%

List Price Reduced

17

14

+3

+21.4%

List Price Increased

1

0

+1

N/A (new activity)

Contingent

0

2

−2

−100%

Listing Expired

13

4

+9

+225%

Listing Pending

11

10

+1

+10%

Listing Sold

5

9

−4

−44.4%

Listing Canceled

4

11

−7

−63.6%

Changes compare the November 1 and October 25 reports, not verified adjacent seven-day periods. Percentage change is (current minus prior) divided by prior, multiplied by 100. A zero prior count with positive current activity is N/A (new activity). Both counts zero is displayed as 0% by convention.

Metric

October 2025

September 2026

October 2026

YoY

MoM

Average Sales Price

$1,024,342

$1,031,981

$906,565

−11.5%

−12.2%

New Listings

99

115

94

−5.1%

−18.3%

Homes for Sale

175

235

225

+28.6%

−4.3%

Pending Sales

63

55

37

−41.3%

−32.7%

Closed Sales

71

59

44

−38%

−25.4%

Median Days on Market

28

28

27

−3.6%

−3.6%

Months Supply Closed

2.2

3.6

3.6

+63.6%

0%

Median Percent of Last List Price

100.0%

99.1%

100.0%

0 pp

+0.9 pp

October 2026 is a displayed completed calendar month; no final/preliminary designation was visible. Source figures may be revised.


Month

National Freddie Mac rate mean

October 2025

6.2540%

November 2025

6.2375%

December 2025

6.1900%

January 2026

6.1025%

February 2026

6.0475%

March 2026

6.1775%

April 2026

6.3320%

May 2026

6.4425%

June 2026

6.4900%

July 2026

6.5420%

August 2026

6.6675%

September 2026

6.8625%

October 2026

7.3280%

Month

Residential average sales price

October 2025

$1,024,342

November 2025

$998,552

December 2025

$938,264

January 2026

$1,029,546

February 2026

$956,719

March 2026

$927,770

April 2026

$1,032,008

May 2026

$1,096,883

June 2026

$1,038,195

July 2026

$1,043,975

August 2026

$993,180

September 2026

$1,031,981

October 2026

$906,565

Sources and scope

Weekly source and timing. NWMLS Matrix Market Watch, Single Family, 7 Day. Current capture: November 1, 2026 at 08:56:49.711 a.m. PST (UTC−08:00), 16:56:49.711 UTC. Prior report capture: October 25, 2026 at 08:33:56.402 a.m. PDT (UTC−07:00), 15:33:56.402 UTC. Every nonzero current category query shows Modification Timestamp October 25, 2026 onward; zero-count categories exposed no result links. The prior Active query showed October 18, 2026 onward, while other prior category boundaries were not individually verified. Exact upper clock boundaries and source query timezone were not displayed. The result set was not revisable. This is a previous-report comparison, not verified adjacent nonoverlapping periods or a confirmed rolling 168-hour window.

Weekly filters and geography. Washington; Snohomish County; MLS City “Snohomish”; Residential; styles 10–18, 25 and 26; exclude Building Information Attached/Zero Lot Line and Incomplete; no price or map restriction. These source-coded filters are a detached-home proxy, not an independent physical-structure audit. MLS city geography can extend beyond municipal boundaries. The MLS “Snohomish” area includes Lake Roesiger and Clearview; this is not a Snohomish County market report.

Events and comparison convention. Listing-status activity can overlap. Active results are not necessarily first-ever listings or current inventory; Sold status activity is not automatically a count grouped by closing date. First Look can subsequently become Active. Do not add event categories as unique homes or use them to calculate absorption. Changes compare the November 1 and October 25 reports, not verified adjacent seven-day periods. Percentage change is (current minus prior) divided by prior, multiplied by 100. A zero prior count with positive current activity is N/A (new activity). Both counts zero is displayed as 0% by convention.

Daylight saving time. Pacific clocks changed from PDT to PST on November 1, 2026. The same local morning time on October 25 and November 1 is 169 elapsed hours apart; seven completed dates October 25–31 end before the clock change. Neither example establishes the source’s unshown cutoff. Collection timestamps retain their actual offsets.

Monthly scope and finality. Authenticated NWMLS InfoSparks, City Snohomish, Residential, all other filter dimensions unrestricted, Monthly, 3 Years. October 2026 is displayed and is now a completed calendar month; no final/preliminary designation was visible. Values may be revised. Monthly comparisons use October 2025, September 2026 and October 2026, not detached-only sales. Average Sales Price reflects the mix of homes sold, not the appreciation of an individual property. Changes are percentages except Median Percent of Last List Price differences, which are percentage points.

Monthly capture and acquisition. Average-price tooltips: November 1, 2026 at 09:09:33.375 a.m. PST, 17:09:33.375 UTC. Supporting metrics: November 1, 2026 at 09:10:25.594 a.m. PST, 17:10:25.594 UTC. Values were transcribed from the visible authenticated interface. The observed InfoSparks URL was https://nwmls.stats.showingtime.com/stats/market; no city-specific URL was exposed.

Matched monthly rates and prices. Thirteen complete common months, October 2025 through October 2026. Rates are calculated arithmetic means of 57 Freddie Mac PMMS weekly 30-year fixed observations grouped by actual publication month, preserving holiday dates. All 13 means were independently recalculated. No native FRED monthly export was used. The official archives were freshly checked November 1, 2026; exact per-request retrieval clocks were not recorded. Rates are national, not city-specific. The aligned panels use separate axes; rate differences are percentage points, price changes are percent. Co-movement does not establish causation or same-home appreciation.

Daily rate context. Mortgage News Daily’s dated observation is October 30, 2026: 30-year fixed 7.27%, daily change −0.02 percentage points. Freshly checked November 1; exact per-request clock unrecorded. This is a static snapshot, not a live widget, personalized loan quote or APR. MND’s daily methodology differs from Freddie Mac’s weekly survey; the series are not interchangeable.

Selected public listings. Active public calls to action are omitted because the public MLS-number fields could not be verified; the source Active event counts are retained. Links, when provided, are selected verified examples rather than exhaustive searches or a complete inventory. The dated Matrix event relationship is separate from current public availability. Public status and asking prices can change. The First Look link uses an exact-match Redfin fallback because the property was absent from Team NSRG’s exact-address results. MLS 2598382 entered First Look on October 27, 2026; the public page matched First look when checked. It is in Lake Roesiger, outside municipal-only geography.

NWMLS Matrix | InfoSparks | Freddie Mac 2025 archive | Freddie Mac current archive | Dated MND report

Work With Us

Our main goal is to exceed your expectations and deliver an exceptional experience that you'll never forget. Contact the team today!

Follow Me on Instagram