
Team NSRG | November 2, 2026 | By Jeremy Minor
Report snapshot: November 2, 2026. The figures below describe that dated report, not a live market feed.

In Mukilteo, I’d start by looking at what else a buyer could choose at a similar price. That can help both sides decide where there may be room to work through terms. A seller’s motivation and equity position matter too. If you’re preparing to list, think about possible concessions before an offer arrives, rather than assuming the asking price will tell the whole story.
Weekly activity covers the MLS Mukilteo area and selected single-family styles. Monthly figures cover the broader Residential market.
The latest report snapshot
With a smaller set of listing events, a few homes can make one report look quite different from the last. I’d keep the focus on properties you would actually consider.
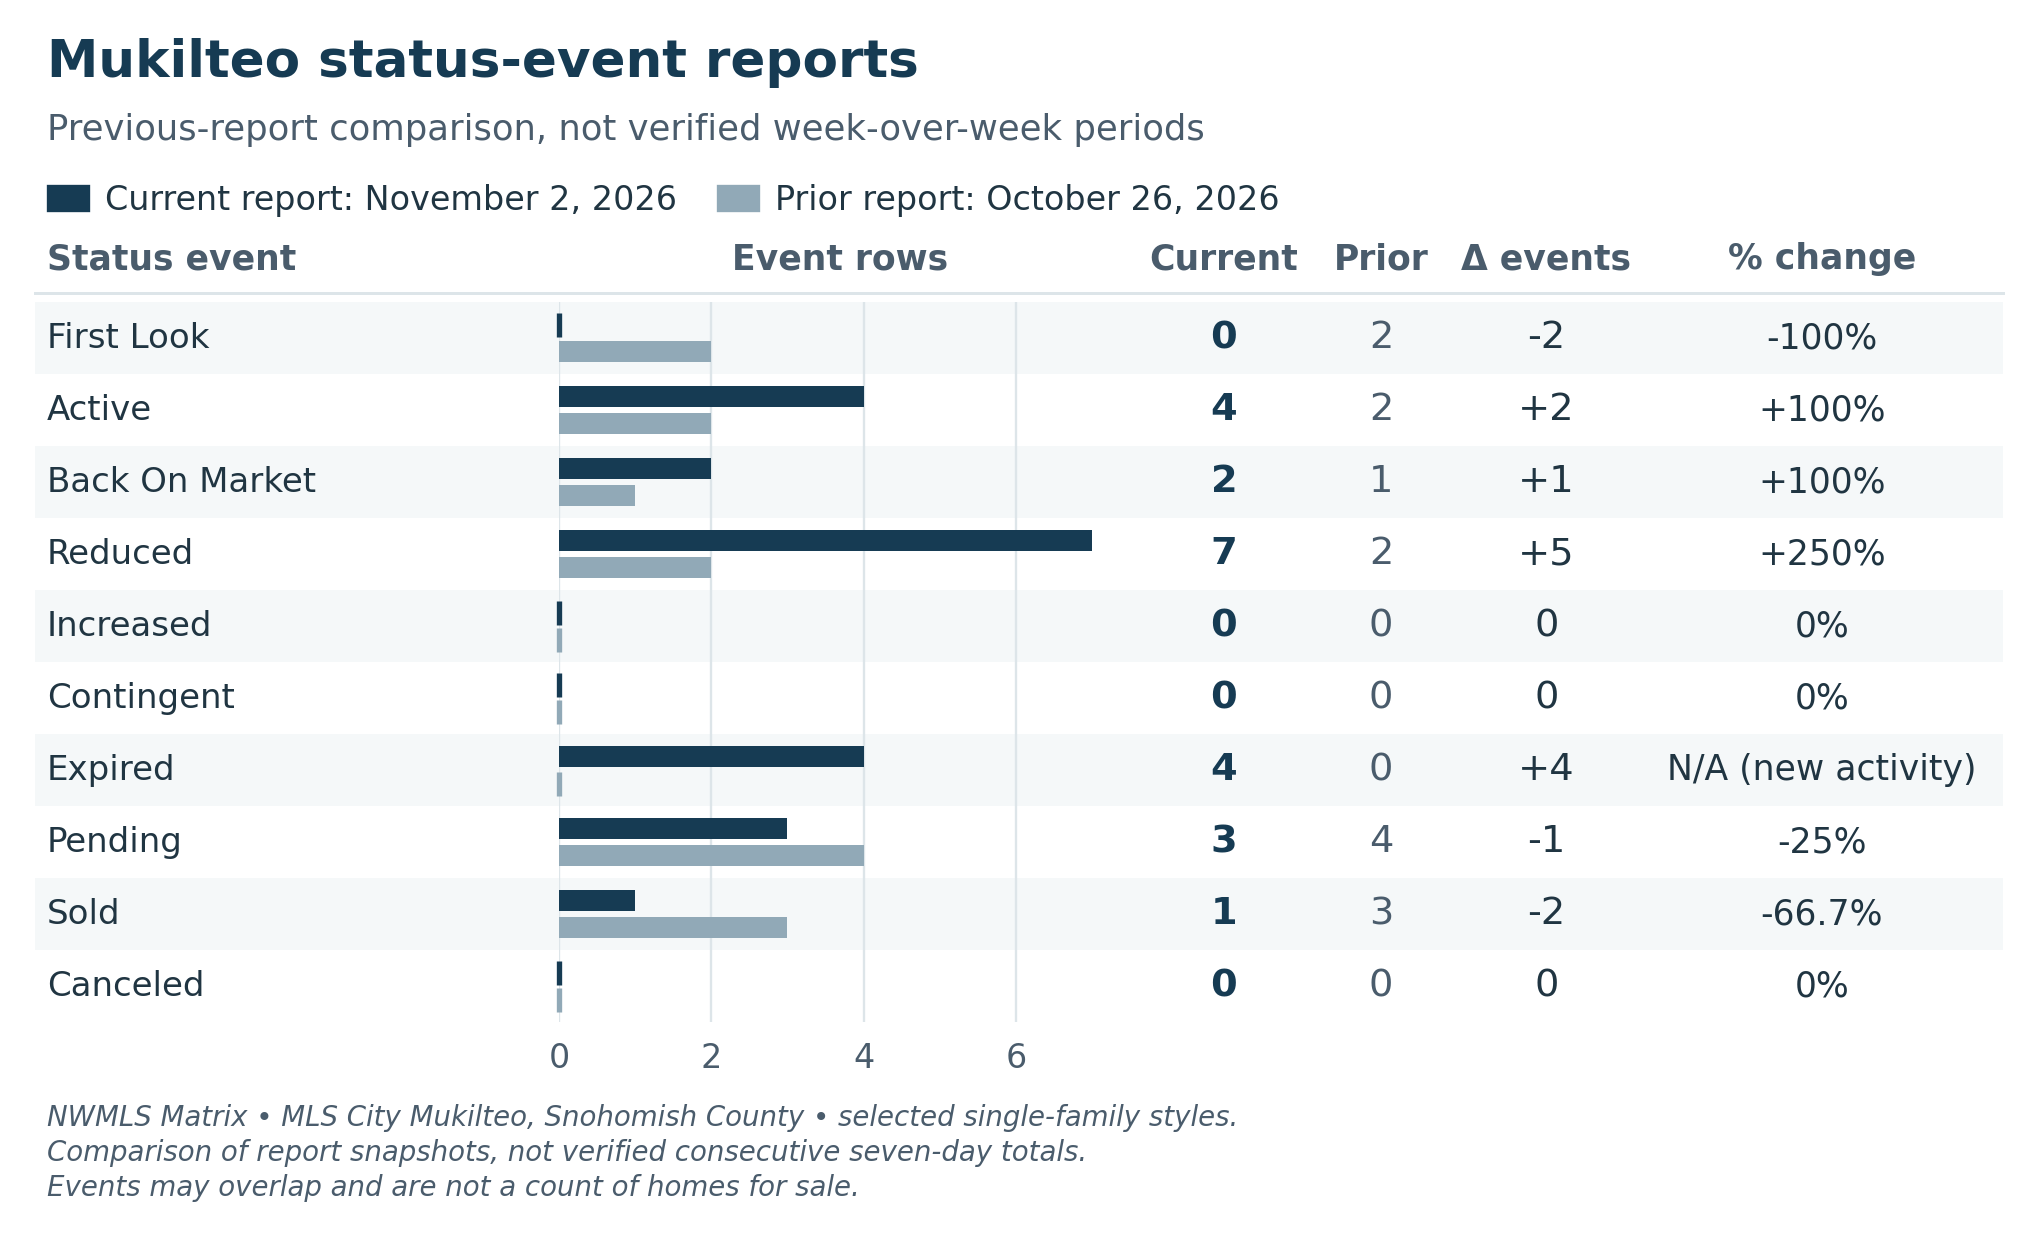
These are two report snapshots, not confirmed separate weeks. A home may appear in more than one category.
October context for your plans
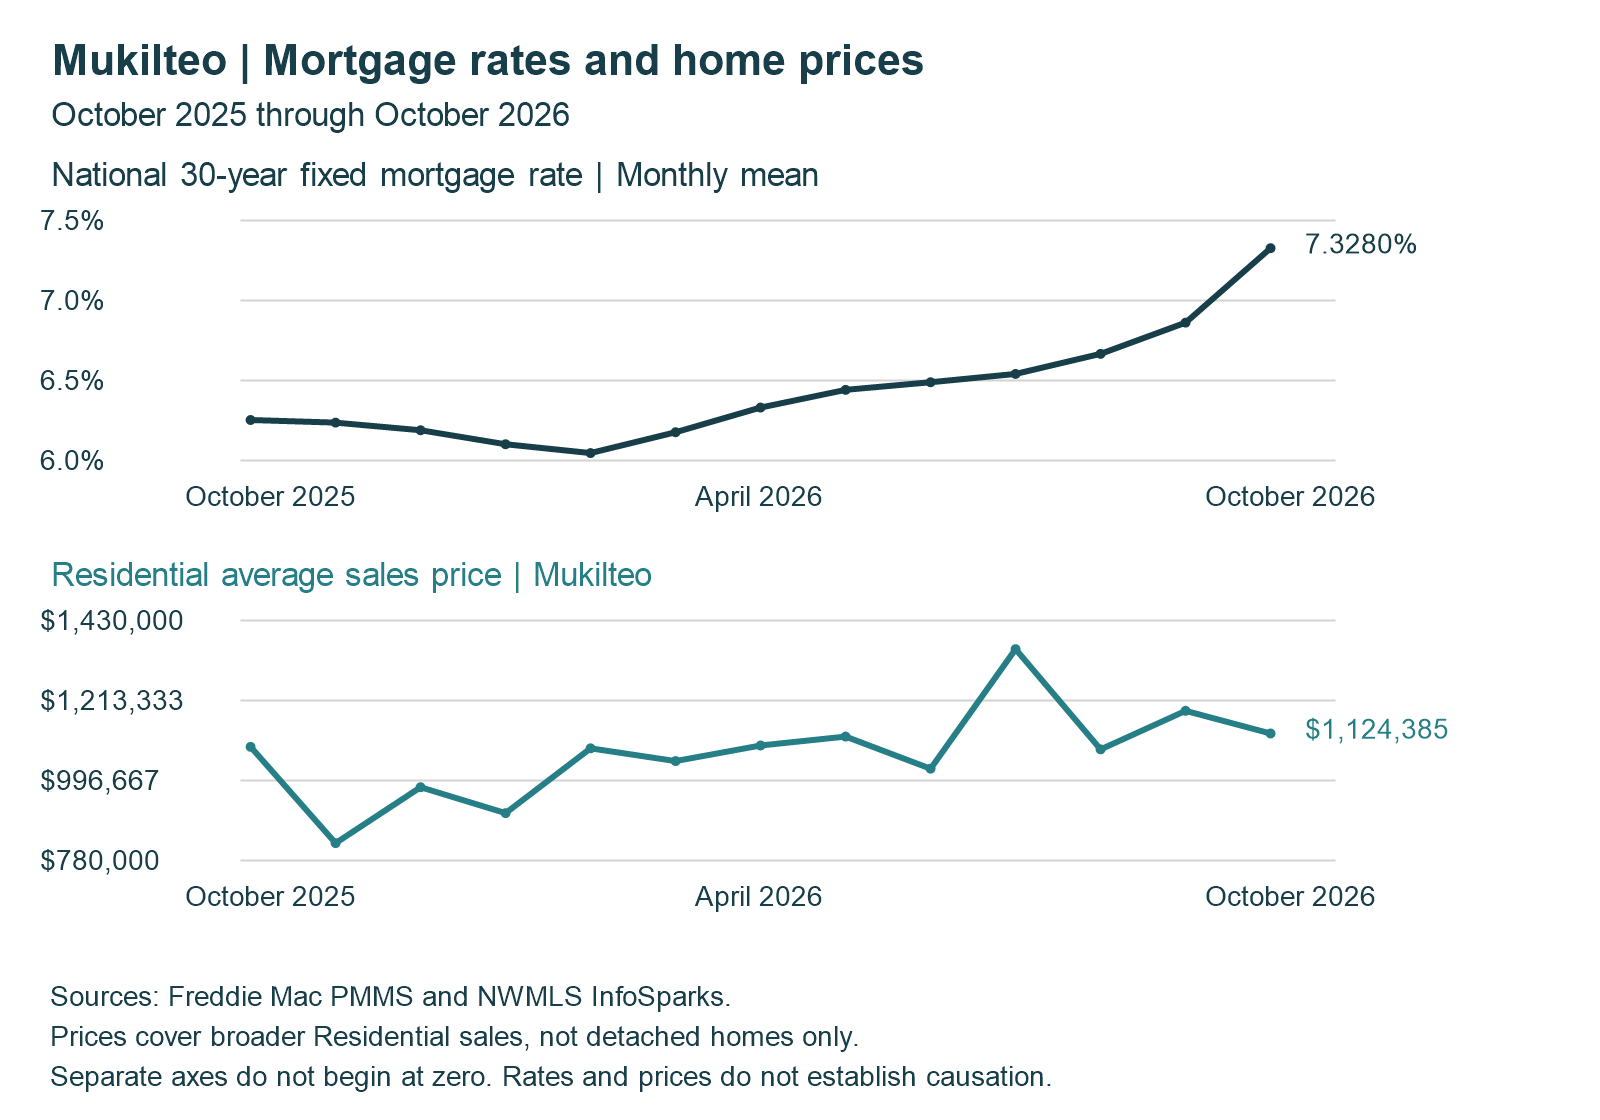
The shorter marketing time in October is encouraging for sellers, though it doesn’t promise a quick sale for any particular home. The mix of homes that closed also matters when you look at the citywide average price.
It’s worth having the payment conversation early, especially if you’re comparing homes at different price points. A lender can help you work out what fits comfortably.
Mortgage-rate snapshot: October 30, 2026
Product | Rate | Daily change |
|---|---|---|
30-year fixed | 7.27% | −0.02 percentage points |
A static snapshot, not a live widget or personalized quote. MND’s daily methodology differs from the monthly Freddie Mac series above.
View live Mortgage News Daily rates | View daily rate movement
Click Below to View Listings
Active-event listings
5521 101st Street SW | MLS 2592366
1605 Goat Trail Road | MLS 2596397
1014 Hill Street | MLS 2596236
Three matching properties from the report’s four dated Active events are linked here. One historical listing has no verified matching destination and is omitted. These examples are not current inventory; prices and availability may change.
If Mukilteo is part of your next move, let’s talk about what you’re looking for and what would make the timing work. Jeremy Minor, Team NSRG.
Contact Jeremy | Email | Call | Book a conversation
The numbers behind the update
Status event | November 2 report | October 26 report | Change | Change % |
|---|---|---|---|---|
First Look | 0 | 2 | −2 | −100% |
Active | 4 | 2 | +2 | +100% |
Back On Market | 2 | 1 | +1 | +100% |
Reduced | 7 | 2 | +5 | +250% |
Increased | 0 | 0 | 0 | 0% |
Contingent | 0 | 0 | 0 | 0% |
Expired | 4 | 0 | +4 | N/A (new activity) |
Pending | 3 | 4 | −1 | −25% |
Sold | 1 | 3 | −2 | −66.7% |
Canceled | 0 | 0 | 0 | 0% |
Metric | October 2025 | September 2026 | October 2026 | YoY | MoM |
|---|---|---|---|---|---|
Average Sales Price | $1,088,397 | $1,185,753 | $1,124,385 | +3.3% | −5.2% |
New Listings | 17 | 31 | 10 | −41.2% | −67.7% |
Homes for Sale | 32 | 56 | 40 | +25% | −28.6% |
Pending Sales | 11 | 22 | 13 | +18.2% | −40.9% |
Closed Sales | 15 | 27 | 13 | −13.3% | −51.9% |
Median Days on Market | 27 | 26 | 23 | −14.8% | −11.5% |
Months Supply Closed Sales | 2.4 | 4.0 | 2.9 | +20.8% | −27.5% |
Median Percent of Last List Price | 99.9% | 99.4% | 97.8% | −2.1 pp | −1.6 pp |
October 2026 is a displayed completed calendar month; no final/preliminary designation was visible. Source figures may be revised.
Month | National Freddie Mac rate mean |
|---|---|
October 2025 | 6.2540% |
November 2025 | 6.2375% |
December 2025 | 6.1900% |
January 2026 | 6.1025% |
February 2026 | 6.0475% |
March 2026 | 6.1775% |
April 2026 | 6.3320% |
May 2026 | 6.4425% |
June 2026 | 6.4900% |
July 2026 | 6.5420% |
August 2026 | 6.6675% |
September 2026 | 6.8625% |
October 2026 | 7.3280% |
Month | Residential average sales price |
|---|---|
October 2025 | $1,088,397 |
November 2025 | $827,486 |
December 2025 | $978,883 |
January 2026 | $908,750 |
February 2026 | $1,084,217 |
March 2026 | $1,049,702 |
April 2026 | $1,091,900 |
May 2026 | $1,116,028 |
June 2026 | $1,029,000 |
July 2026 | $1,352,909 |
August 2026 | $1,081,325 |
September 2026 | $1,185,753 |
October 2026 | $1,124,385 |