Team NSRG | October 31, 2026
There may be room to negotiate in Mill Creek, depending on the home and the seller’s situation. Understanding the seller’s equity position and motivation may help a buyer put together an offer that works for both sides. If you’re selling, I’d think about possible concessions when setting the price and preparing the home. A home that stands out from its competition may be in a different position, but it’s still worth being ready for requests for concessions or price reductions.
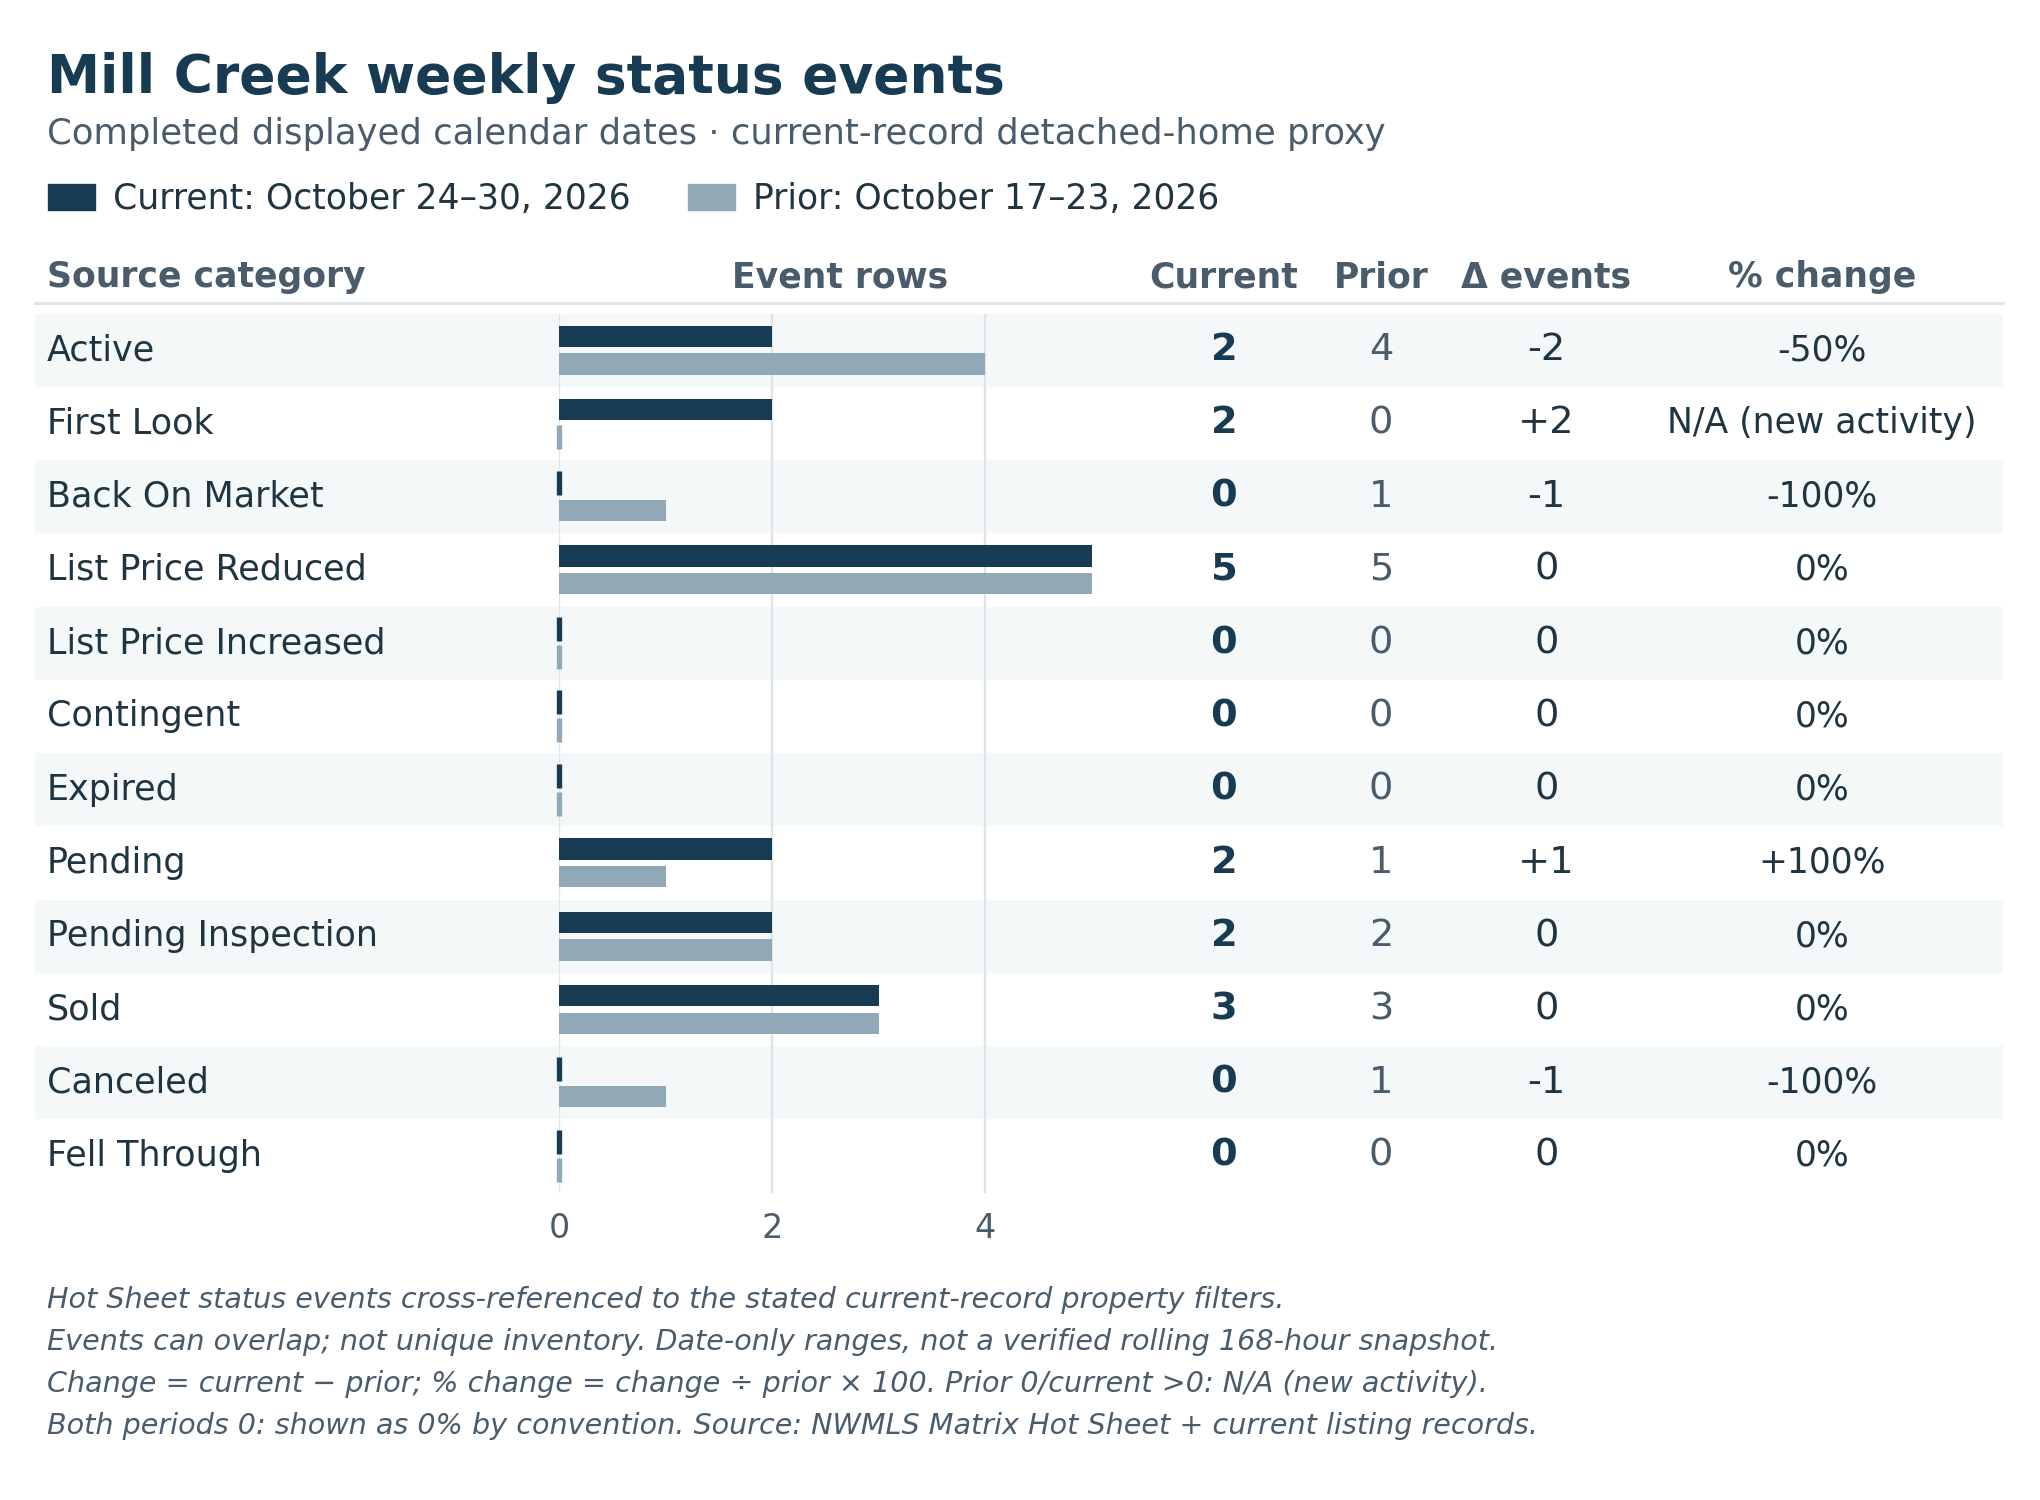
With a smaller group of events in Mill Creek, a few individual homes can make the week look different. These are events, not current inventory or unique homes. Weekly property filters and broader Residential monthly data describe different scopes.
Weekly activity and practical context A First Look listing can later move to Active, so the same home may appear in more than one category.
Open the full-size chart . Exact values are in the accessible detailed data below.
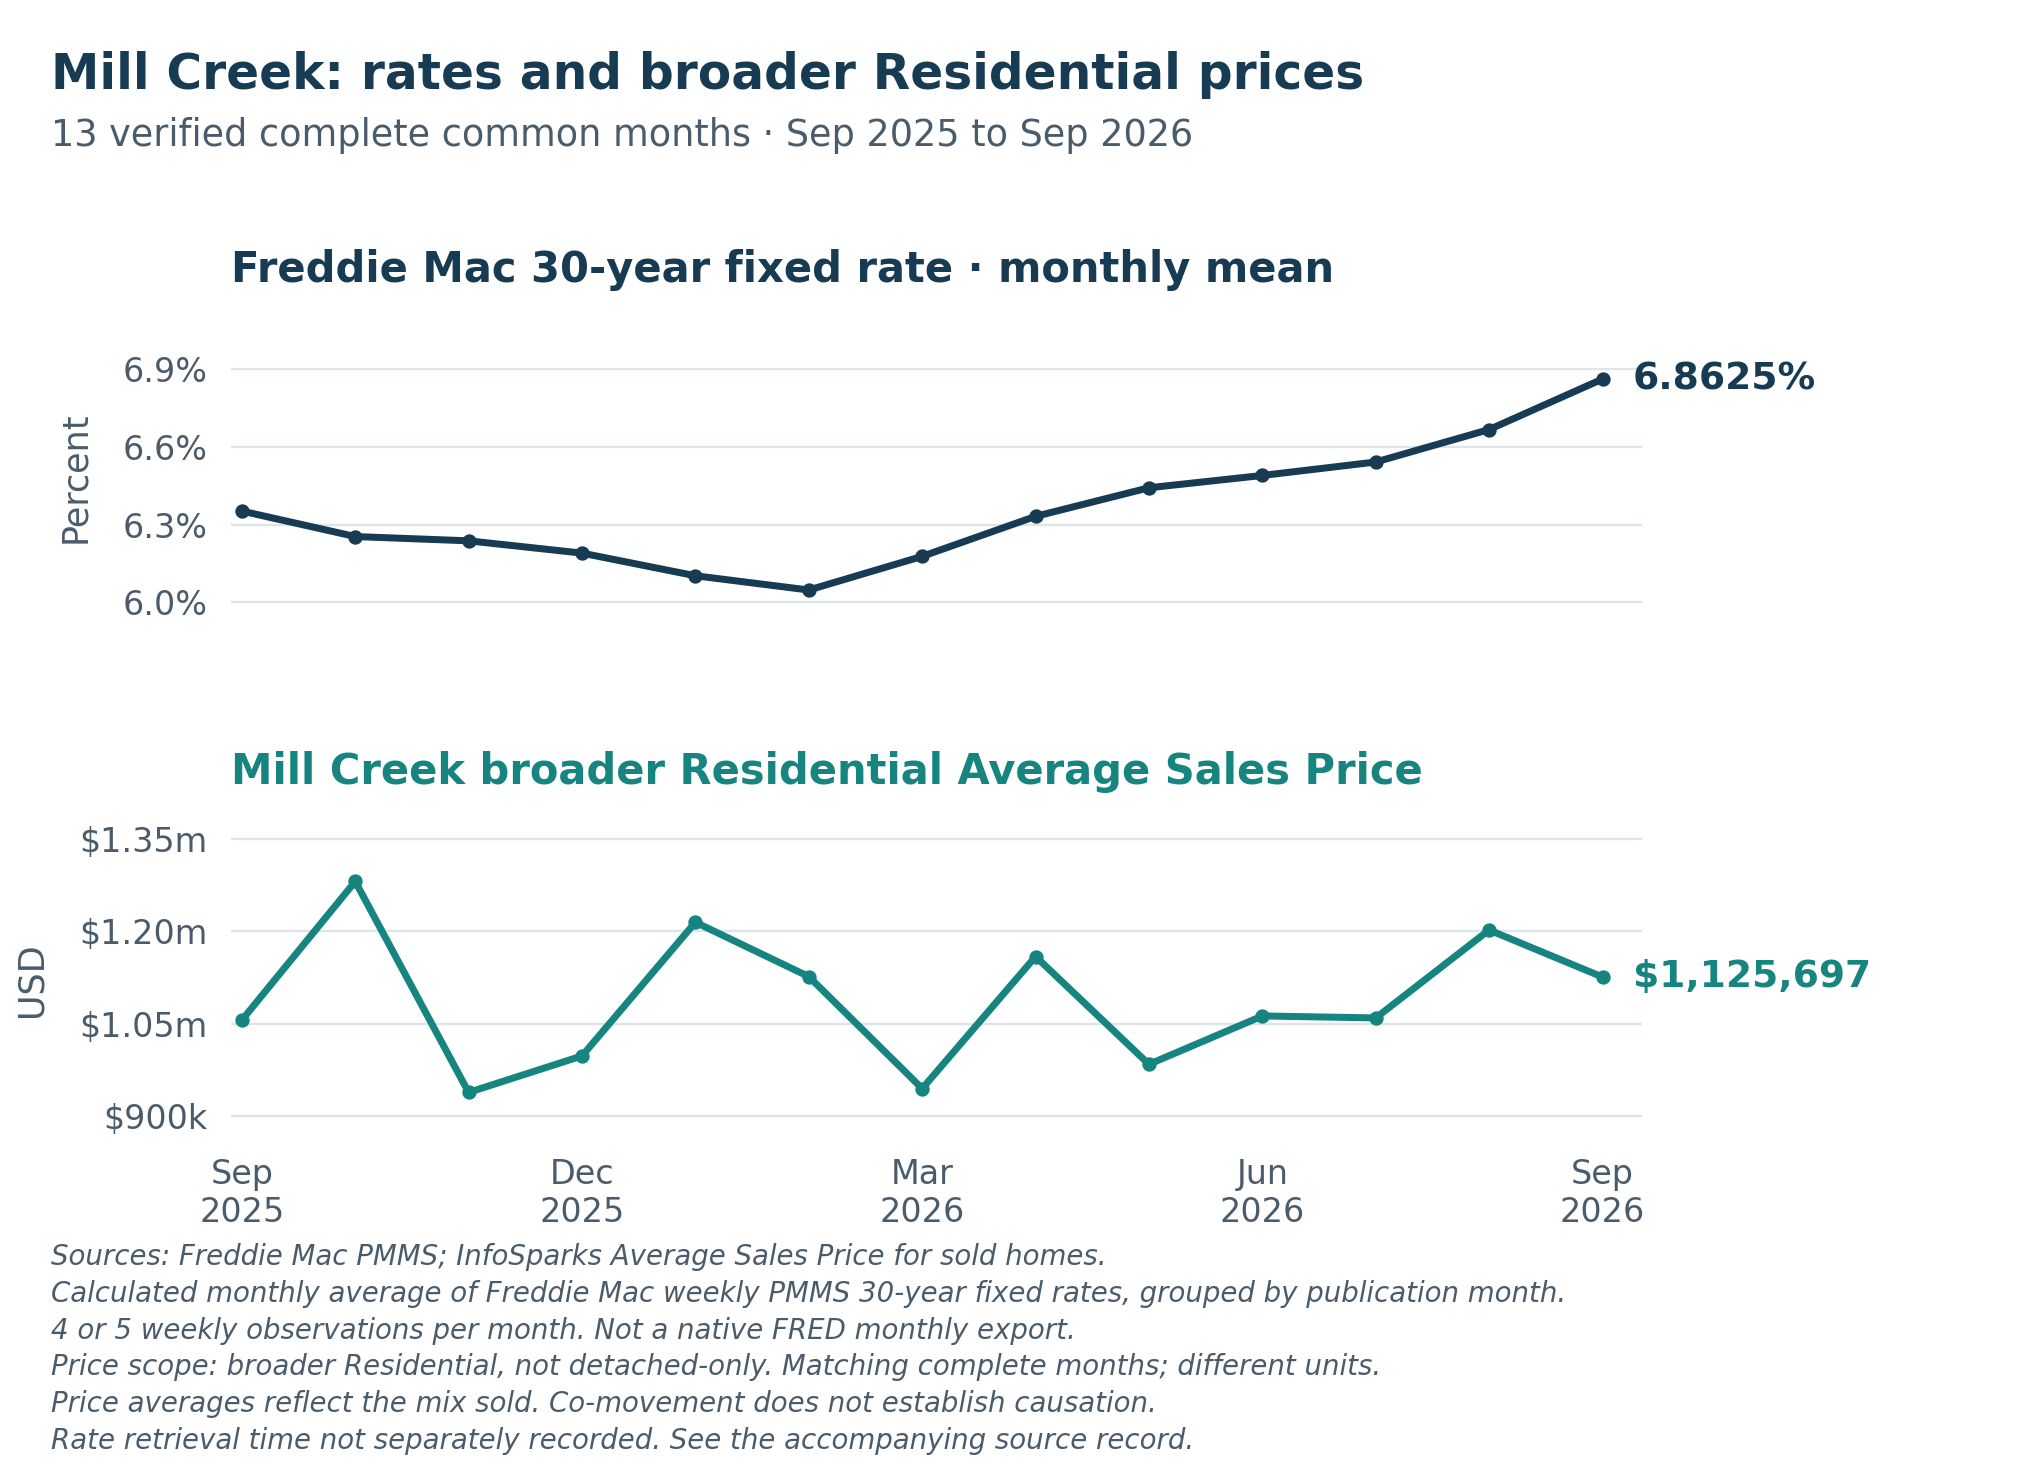
Monthly context for your next decision The quicker pace in September may be encouraging if you’re thinking about selling. These monthly figures are broader Residential context, not a detached-only valuation.
The monthly payment still matters in Mill Creek. Before getting too attached to an asking price, it can help to talk through how the rate and the terms of an offer might fit your budget.
A change in the average can reflect a different mix of sales; it doesn’t tell us that each home gained or lost the same amount, or that rates caused the change.
Monthly rates and average sales price Open the full-size chart . Exact values are in the accessible detailed data below.
Mortgage News Daily current rate snapshot Dated snapshot: October 30, 2026. Not live or automatically updating.
Product
Latest rate
Daily movement
Thirty year fixed
7.27%
−0.02 pp
View live Mortgage News Daily rates View daily rate movement
If a move in Mill Creek is on your mind, let’s talk about what you’re hoping to accomplish. Jeremy Minor, Team NSRG.
Talk with Jeremy Minor about your plans
Accessible detailed data Weekly status events and changes Source category
Oct 24–30 2026
Oct 17–23 2026
Count change
Percent change
Active
2
4
−2
−50%
First Look
2
0
+2
N/A (new activity)
Back On Market
0
1
−1
−100%
List Price Reduced
5
5
0
0%
List Price Increased
0
0
0
0%
Contingent
0
0
0
0%
Expired
0
0
0
0%
Pending
2
1
+1
+100%
Pending Inspection
2
2
0
0%
Sold
3
3
0
0%
Canceled
0
1
−1
−100%
Fell Through
0
0
0
0%
Broader Residential monthly comparisons Metric
Sep 2025
Aug 2026
Sep 2026
YoY
MoM
Average sales price
$1,055,753
$1,202,057
$1,125,697
+6.6%
−6.4%
New listings
17
29
21
+23.5%
−27.6%
Homes for sale
31
43
44
+41.9%
+2.3%
Pending sales
8
19
15
+87.5%
−21.1%
Closed sales
16
9
19
+18.8%
+111.1%
Median days on market
37
28
25
−32.4%
−10.7%
Months supply based on closed sales
2.1
3.9
3.9
+85.7%
0%
Median percent of last list price
98.6%
97.7%
97.6%
−1 pp
−0.1 pp
Exact monthly rate and Average Sales Price series Monthly Freddie Mac rate Month
30-year fixed mean
September 2025
6.3525%
October 2025
6.2540%
November 2025
6.2375%
December 2025
6.1900%
January 2026
6.1025%
February 2026
6.0475%
March 2026
6.1775%
April 2026
6.3320%
May 2026
6.4425%
June 2026
6.4900%
July 2026
6.5420%
August 2026
6.6675%
September 2026
6.8625%
Monthly Average Sales Price Month
Average Sales Price
September 2025
$1,055,753
October 2025
$1,280,909
November 2025
$938,321
December 2025
$997,600
January 2026
$1,214,667
February 2026
$1,126,389
March 2026
$944,563
April 2026
$1,158,986
May 2026
$983,958
June 2026
$1,062,466
July 2026
$1,059,279
August 2026
$1,202,057
September 2026
$1,125,697
Sources and scope Weekly source and dates. Hot Sheet status events cross-referenced to the stated current-record property filters. Current displayed dates: October 24, 2026 through October 30, 2026. Prior displayed dates: October 17, 2026 through October 23, 2026. Both ranges include their endpoints; partial October 31 events are excluded. This is Matrix Change Type History / Hot Sheet, not a MarketWatch snapshot or a verified rolling 168-hour window. Source intraday boundaries and timezone were not displayed; Pacific is the market reporting convention, not a confirmed source timezone.
Exact weekly filters. Days Back 0–14; displayed Modification Timestamp October 31, 2026 to October 17, 2026; Washington; King and Snohomish counties; City Mill Creek; Property Type Single Family. Observed IDs were cross-referenced in Single Family General to Residential subtype; styles 10, 11, 12, 13, 14, 15, 16, 17, 18, 25 and 26; NOT Building Information Attached or Zero Lot Line; Status is not Incomplete; no listing, sold or off-market date cutoff. Sale types: MLS; For Sale By Owner or Other MLS; Seller Representation Agreement; For Rent By Owner or Other MLS; Landlord Representation Agreement. Geography follows source City selections and selected counties, not an independently reconciled municipal boundary or saved MarketWatch area. Classification uses current records, not an independent historical detached-home audit. All 388 unique MLS IDs from the two city history results were submitted; 214 returned under the combined criteria. The individual exclusion reasons for the remaining 174 IDs were not audited, and no unrestricted availability audit was performed. No claim is made that every nonmatch is non-detached or that these counts provide full MarketWatch coverage.
Event definitions and changes. Active means status-change events, not new listings or current inventory. Sold means status-change events, not automatically sales grouped by closing date. Pending can include movements among pending statuses. Categories overlap and cross-listed homes may have different MLS IDs; do not sum the counts as unique homes or calculate absorption from them. Percentage change is (current minus prior) divided by prior, multiplied by 100. A zero prior count with positive current activity is N/A (new activity). When both counts are zero, 0% is a display convention rather than a division result.
Monthly property scope. InfoSparks City Mill Creek; Residential; all style codes, price ranges, bedrooms, lot sizes, construction types, square footages, waterfront and transaction sides; Monthly; 3 Years. Monthly figures are broader than detached-only. September 1, 2026 through September 30, 2026 is compared with August 1, 2026 through August 31, 2026 and September 1, 2025 through September 30, 2025. Changes use displayed values; year-over-year and month-over-month are percent changes, except median percent of last list price, which uses percentage points. Average Sales Price describes the mix sold, not appreciation of the same home.
Average Sales Price source. InfoSparks Average Sales Price for sold homes, Monthly, Residential, all other recorded filters unchanged; the two cities were verified separately. Broader Residential, not detached-only. Source: Authenticated InfoSparks city chart. Retrieval: October 31, 2026 at 17:24:15 UTC / 10:24:15 a.m. PDT (UTC−07:00). Source vintage: Chart observations captured October 31, 2026
Monthly rate source and common dates. Calculated monthly average of Freddie Mac weekly PMMS 30-year fixed rates, grouped by publication month. Holiday publication dates are preserved; incomplete October 2026 is excluded. No native FRED monthly export was used. The paired chart uses 13 complete common months, September 2025 through September 2026; neither series uses a second axis. Rate differences are percentage points; price changes are percent. All 56 retained weekly PMMS observations were grouped by their actual publication month, including holiday publication dates. Exact Decimal recomputation matches all 13 supplied monthly means and observation counts. This is calculated from weekly Freddie Mac PMMS, not a native FRED monthly export. Source: https://www.freddiemac.com/pmms/archive. Retrieval: October 31, 2026; separate rate-series retrieval time not recorded in the supplied source addendum. Vintage: October 31, 2026 retained archive observations
Current rate snapshot. Mortgage News Daily is a distinct daily series and methodology from the calculated monthly Freddie Mac chart. This is a date-stamped original snapshot, not a live or automatically updating dashboard, personalized quote or APR. Displayed observation date: October 30, 2026. Retrieval: October 31, 2026 at 17:29 UTC. Rates are percentages; daily changes are percentage points. Source: https://www.mortgagenewsdaily.com/markets/mortgage-rates-10302026.
Selected listing examples. The linked properties are selected, nonexhaustive verified examples, not search results or a complete list of activity. The event relationship comes from Matrix, not from the public listing page: MLS 2598848: Active event on October 30, 2026. Public pages matched the address, city, MLS ID, price and Active status when checked. Availability and asking prices can change.
Listing destination limitation. First Look public destinations could not be verified on Team NSRG or as eligible Redfin/Zillow detail pages. No First Look listing links are provided; a missing destination does not change the verified event count. No unsupported search URL has been invented.
First Look listings. First Look entries are not current First Look inventory. NWMLS permits up to 21 days of public marketing; showings and IDX publication are optional at seller direction. A later Active event can overlap a First Look entry. Live availability can differ from a dated event. NWMLS source: https://www.nwmls.com/northwest-mls-expands-listing-options/
Original collection timing. The retained Matrix and original monthly-metric collection batch was recorded October 31, 2026 at 16:53:06 UTC / 9:53:06 a.m. PDT (UTC−07:00). Individual original query times were not recorded. Updated price, rate and link retrieval timestamps are recorded separately above and in the source package.
Source links: https://www.freddiemac.com/pmms/archive · https://www.freddiemac.com/pmms/archive?year=2025 · https://www.mortgagenewsdaily.com/markets/mortgage-rates-10302026 · https://www.nwmls.com/northwest-mls-expands-listing-options/