
Team NSRG | November 2, 2026 | By Jeremy Minor

When you find an Everett home you like, it’s worth learning a little more before deciding what to offer. A seller’s equity position and reason for moving can help you understand which terms might work. If you’re selling, I’d consider possible concessions as you set the price, while giving buyers a clear reason to choose your home over similar options.
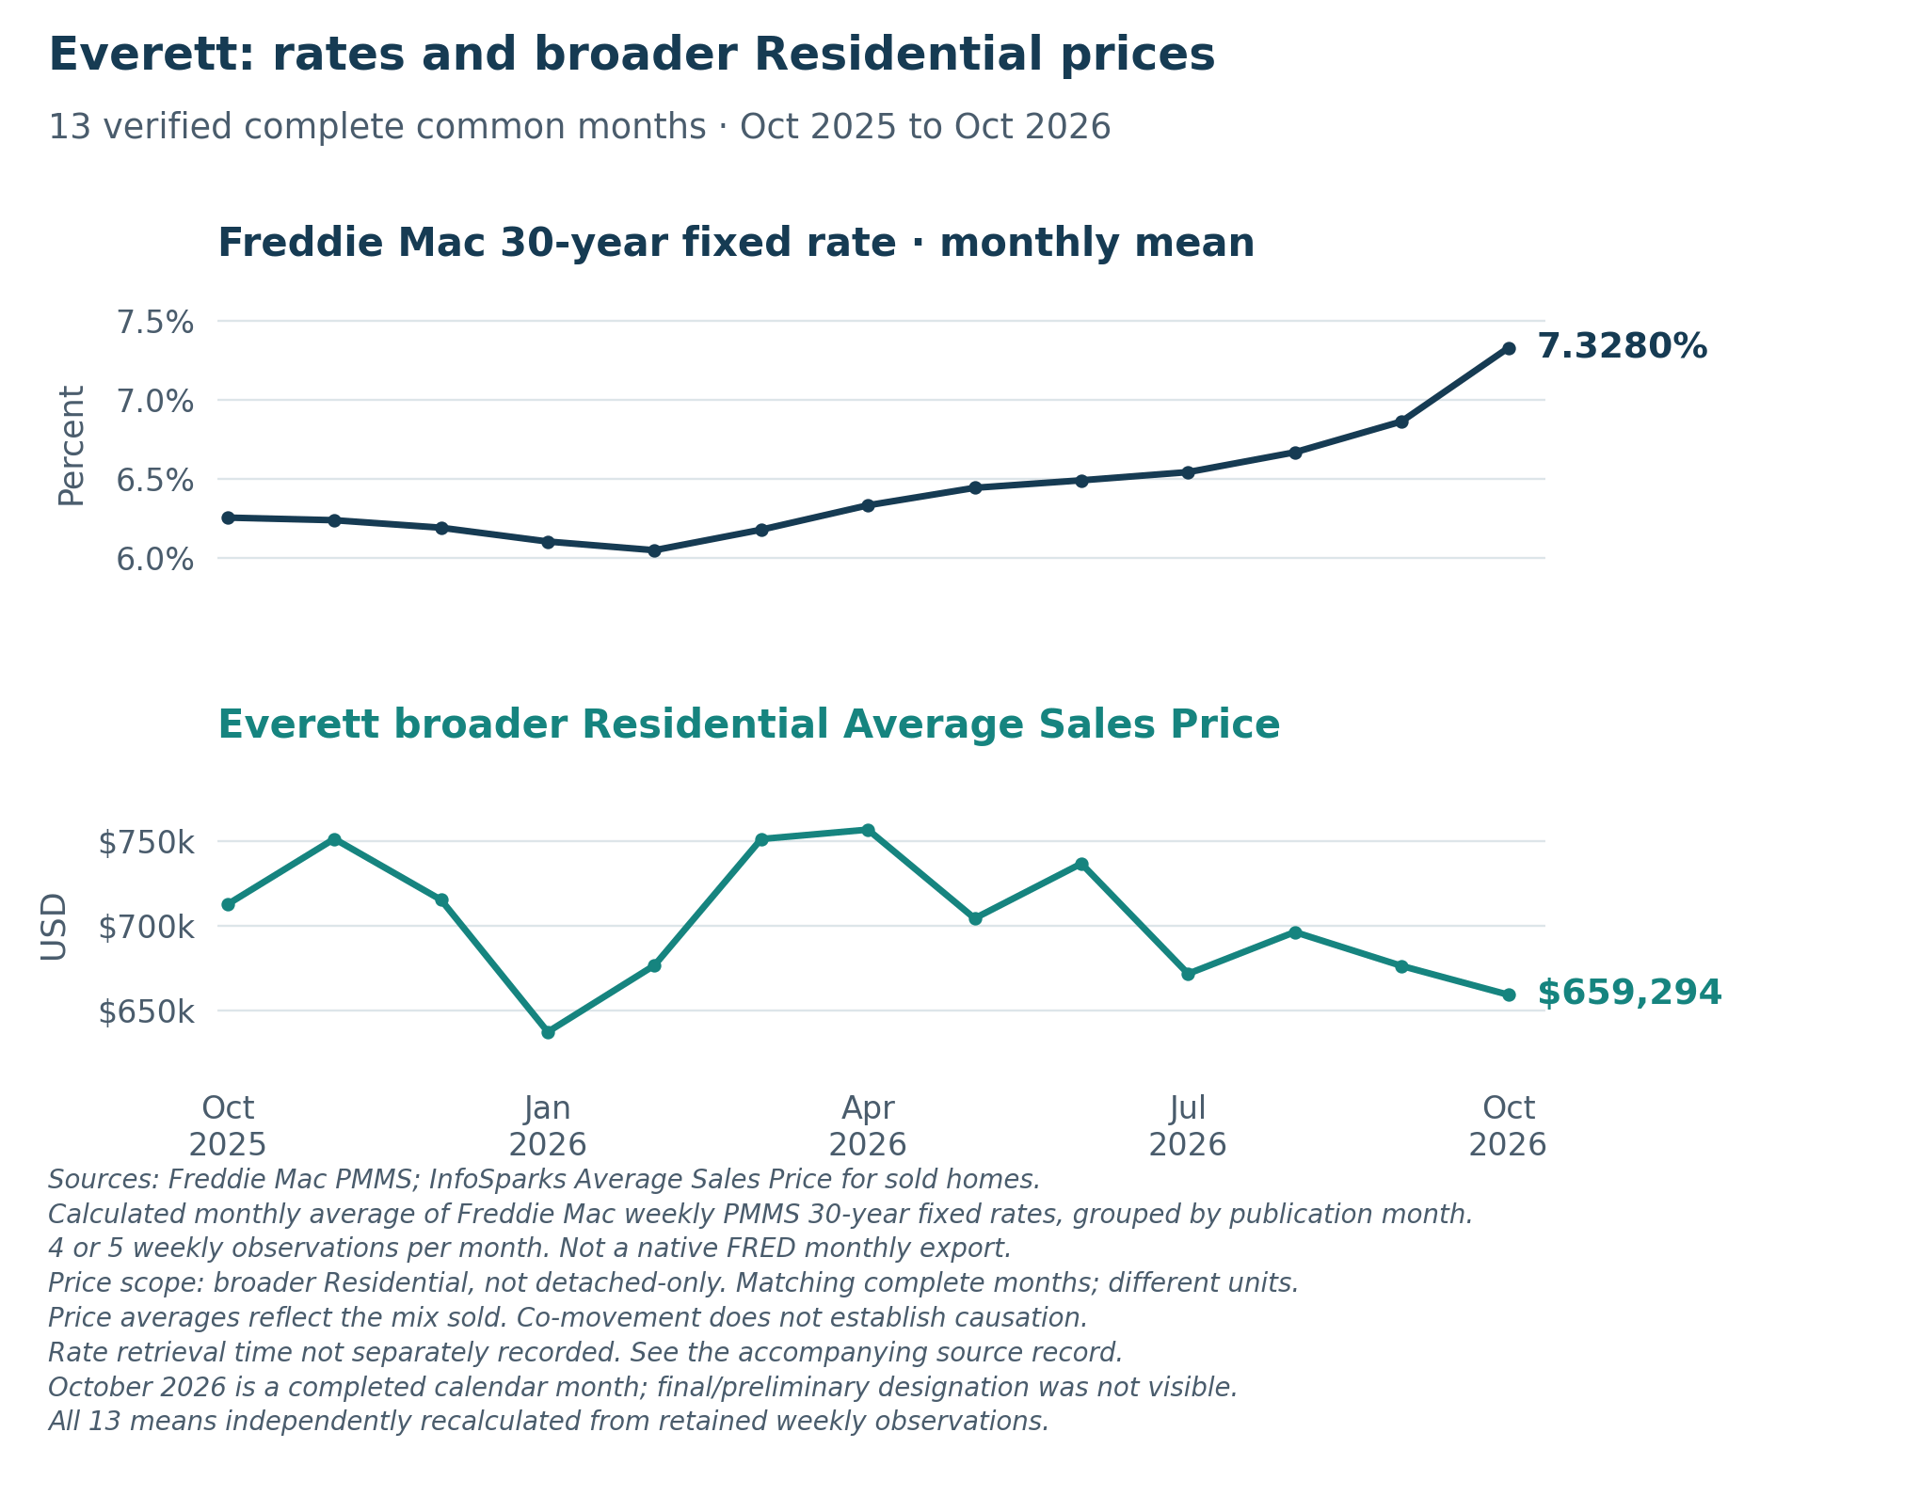
Weekly figures use the MLS Everett market area and the source-coded property filters described below. Those filters are not an independent check of every home’s structure or the city limits. Monthly figures cover broader Residential homes.
The latest report snapshot
A pending sale still has steps to clear before closing. I’d watch how that activity develops before drawing a broader conclusion from one report.
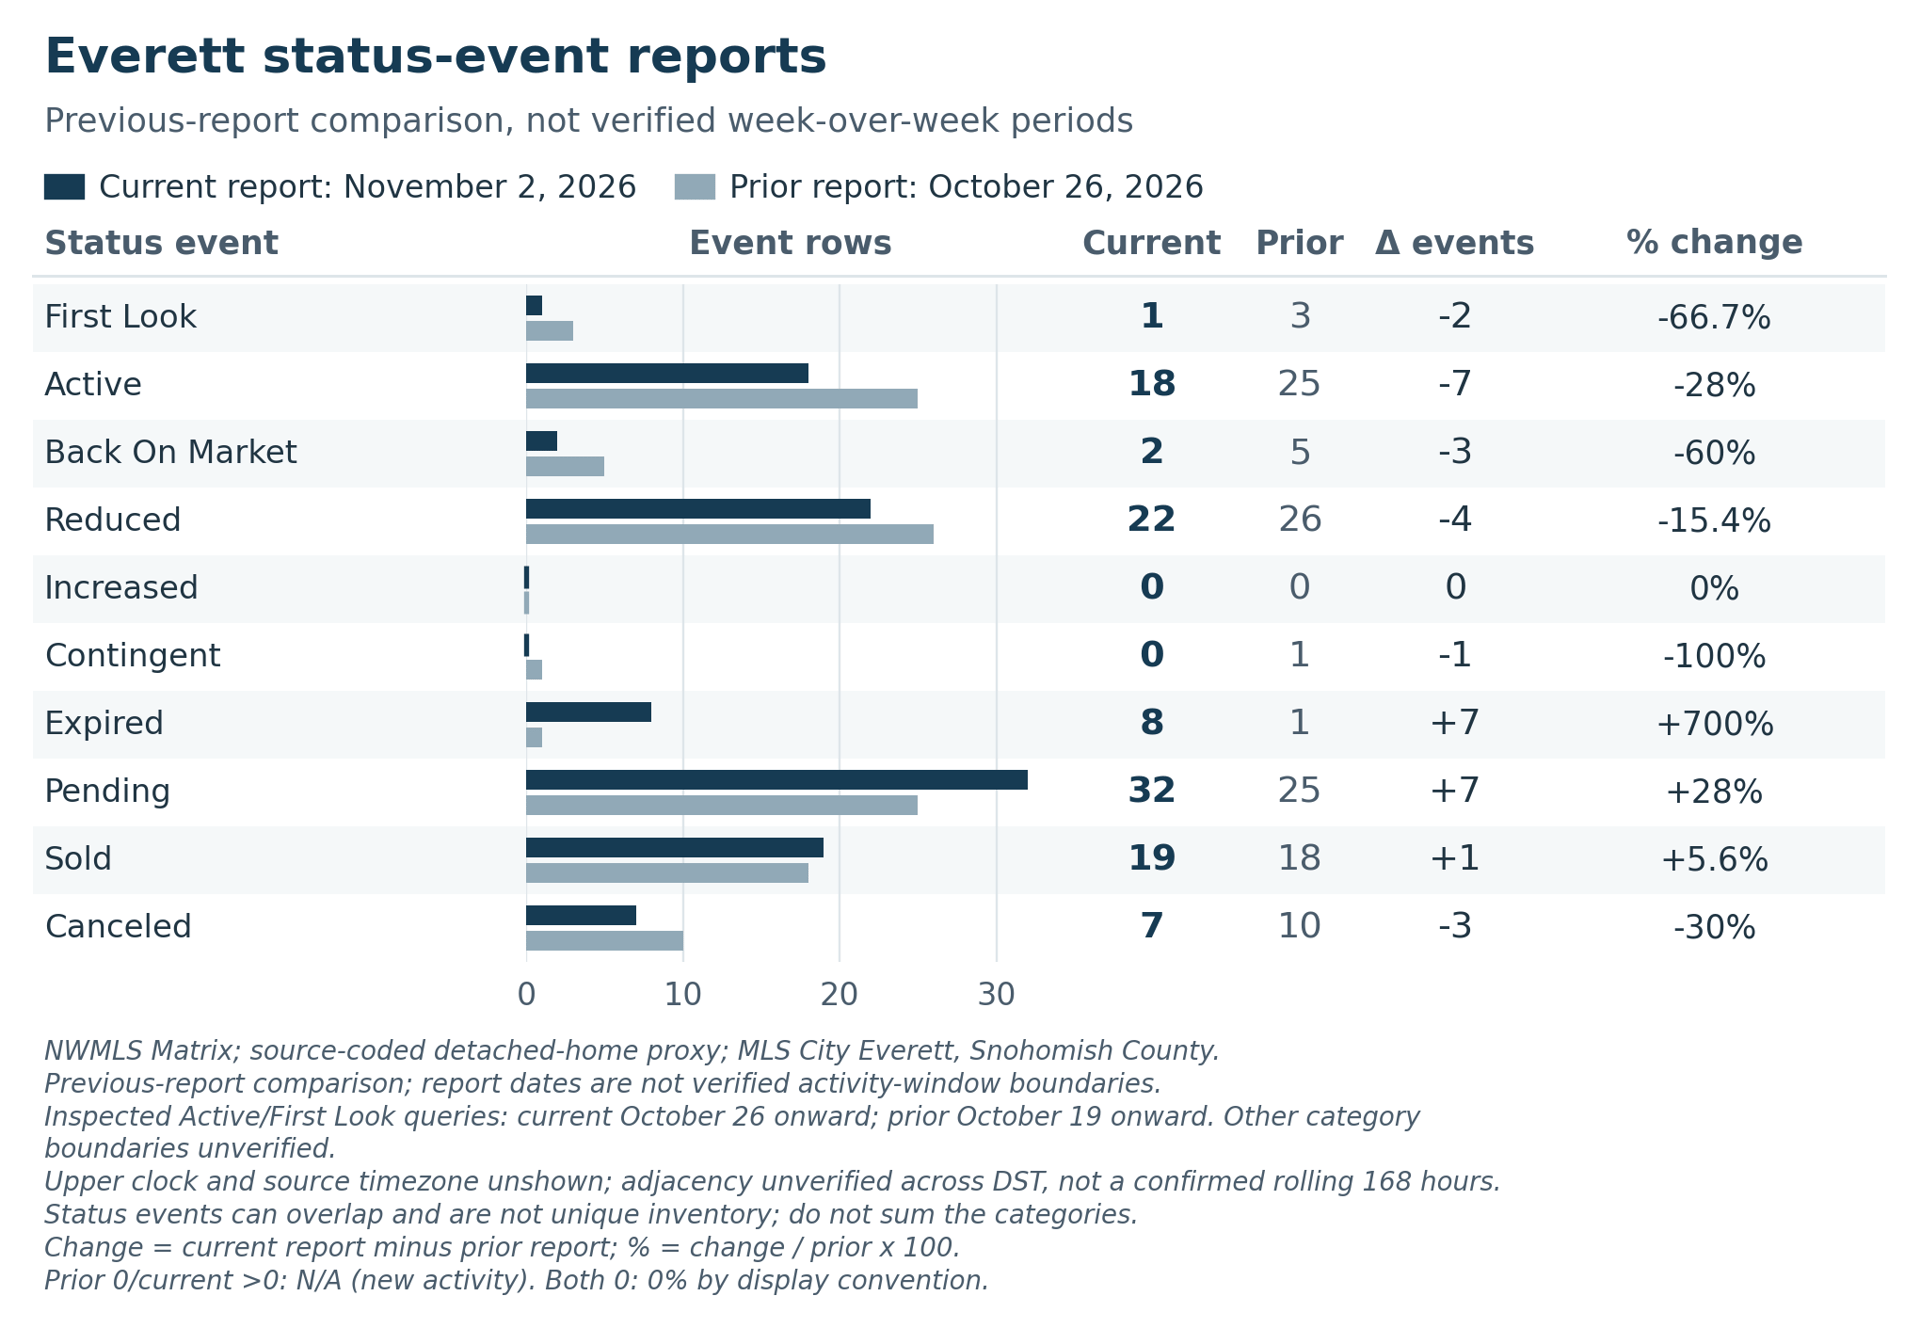
Previous-report comparison, not verified adjacent seven-day windows. Status events overlap and are not unique inventory.
Click Below to View Listings
Active-event listings
5027 126th Street SE | MLS 2599397
2917 Forest View Drive | MLS 2598955
1701 Mcdougall Avenue | MLS 2599363
2427 Monroe Avenue | MLS 2599937
5615 1st Avenue SE | MLS 2599741
2118 Jackson Avenue | MLS 2599788
13926 Silver Firs Drive | MLS 2598852
10507 Rosewood Avenue | MLS 2599672
8521 Holly Drive | MLS 2599053
2517 Helena Lane | MLS 2598663
9116 10th Avenue SE | MLS 2598928
4012 Rucker Avenue | MLS 2599175
2306 Pine Street | MLS 2598931
11303 1st Place W | MLS 2598912
12103 E Gibson Road | MLS 2591705
1515 Lombard Avenue | MLS 2598243
These 18 properties matched the report’s dated Active events. Status transitions are not necessarily first-ever listings, and these links are not a count of current inventory. Prices and availability may change.
First Look Listings
3217 54th Street SW | MLS 2596518 (Redfin)*
*This external detail page matched the dated First Look record when checked. Public status may change.
October context for your plans
October’s longer marketing time is worth keeping in mind if you’re trying to coordinate a sale and your next move. A little flexibility in the schedule may help, even when the home is well prepared.
Before settling on an offer price, it helps to know what monthly payment feels comfortable for you. Your lender can work through the details for the home and loan you’re considering.
Mortgage-rate snapshot: October 30, 2026
Product | Rate | Daily change |
|---|---|---|
30-year fixed | 7.27% | −0.02 percentage points |
A static snapshot, not a live widget or personalized quote. MND’s daily methodology differs from the monthly Freddie Mac series above.
View live Mortgage News Daily rates | View daily rate movement
If you’re considering a move in Everett, I’m happy to help you work through the options that fit your plans. Jeremy Minor, Team NSRG.
Contact Jeremy | Email | Call | Book a conversation
The numbers behind the update
Status event | November 2 report | October 26 report | Change | Change % |
|---|---|---|---|---|
First Look | 1 | 3 | −2 | −66.7% |
Active | 18 | 25 | −7 | −28% |
Back On Market | 2 | 5 | −3 | −60% |
Reduced | 22 | 26 | −4 | −15.4% |
Increased | 0 | 0 | 0 | 0% |
Contingent | 0 | 1 | −1 | −100% |
Expired | 8 | 1 | +7 | +700% |
Pending | 32 | 25 | +7 | +28% |
Sold | 19 | 18 | +1 | +5.6% |
Canceled | 7 | 10 | −3 | −30% |
Changes compare the November 2 and October 26 reports, not verified adjacent seven-day periods. Percentage change is (current minus prior) divided by prior, multiplied by 100. A zero prior count with positive current activity is N/A (new activity). Both counts zero is displayed as 0% by convention.
Metric | October 2025 | September 2026 | October 2026 | YoY | MoM |
|---|---|---|---|---|---|
Average Sales Price | $712,624 | $676,297 | $659,294 | −7.5% | −2.5% |
New Listings | 125 | 128 | 129 | +3.2% | +0.8% |
Homes for Sale | 225 | 294 | 288 | +28% | −2% |
Pending Sales | 85 | 73 | 82 | −3.5% | +12.3% |
Closed Sales | 85 | 71 | 73 | −14.1% | +2.8% |
Median Days on Market | 14 | 16 | 23 | +64.3% | +43.8% |
Months Supply Closed Sales | 2.3 | 3.5 | 3.5 | +52.2% | 0% |
Median Percent of Last List Price | 100.0% | 100.0% | 98.5% | −1.5 pp | −1.5 pp |
October 2026 is a displayed completed calendar month; no final/preliminary designation was visible. Source figures may be revised.
Month | National Freddie Mac rate mean |
|---|---|
October 2025 | 6.2540% |
November 2025 | 6.2375% |
December 2025 | 6.1900% |
January 2026 | 6.1025% |
February 2026 | 6.0475% |
March 2026 | 6.1775% |
April 2026 | 6.3320% |
May 2026 | 6.4425% |
June 2026 | 6.4900% |
July 2026 | 6.5420% |
August 2026 | 6.6675% |
September 2026 | 6.8625% |
October 2026 | 7.3280% |
Month | Residential average sales price |
|---|---|
October 2025 | $712,624 |
November 2025 | $751,216 |
December 2025 | $715,216 |
January 2026 | $637,359 |
February 2026 | $676,624 |
March 2026 | $751,093 |
April 2026 | $756,613 |
May 2026 | $704,300 |
June 2026 | $736,611 |
July 2026 | $671,647 |
August 2026 | $696,251 |
September 2026 | $676,297 |
October 2026 | $659,294 |