Team NSRG | October 27, 2026 | By Jeremy Minor
Historical report snapshot: October 27, 2026. Market figures below reflect that report date; listing-status notes were checked November 3, 2026. This is not a current-week market update.

Edmonds is giving buyers more choice without delivering a simple citywide pricing story. September's broader Residential market had more homes for sale and fewer closings than a year earlier, yet a higher average sold-home price. My read is that the particular home and its comparable sales matter much more than a single headline.
What Buyers And Sellers Can Take From This
For buyers: Use the larger selection to compare condition, location and value carefully. A higher citywide average does not mean every home has gained the same amount.
For sellers: Make the asking price easy to justify with relevant comparable homes. More alternatives mean buyers can scrutinize your home closely, even when the monthly average price rises.
The October 27 Report Snapshot
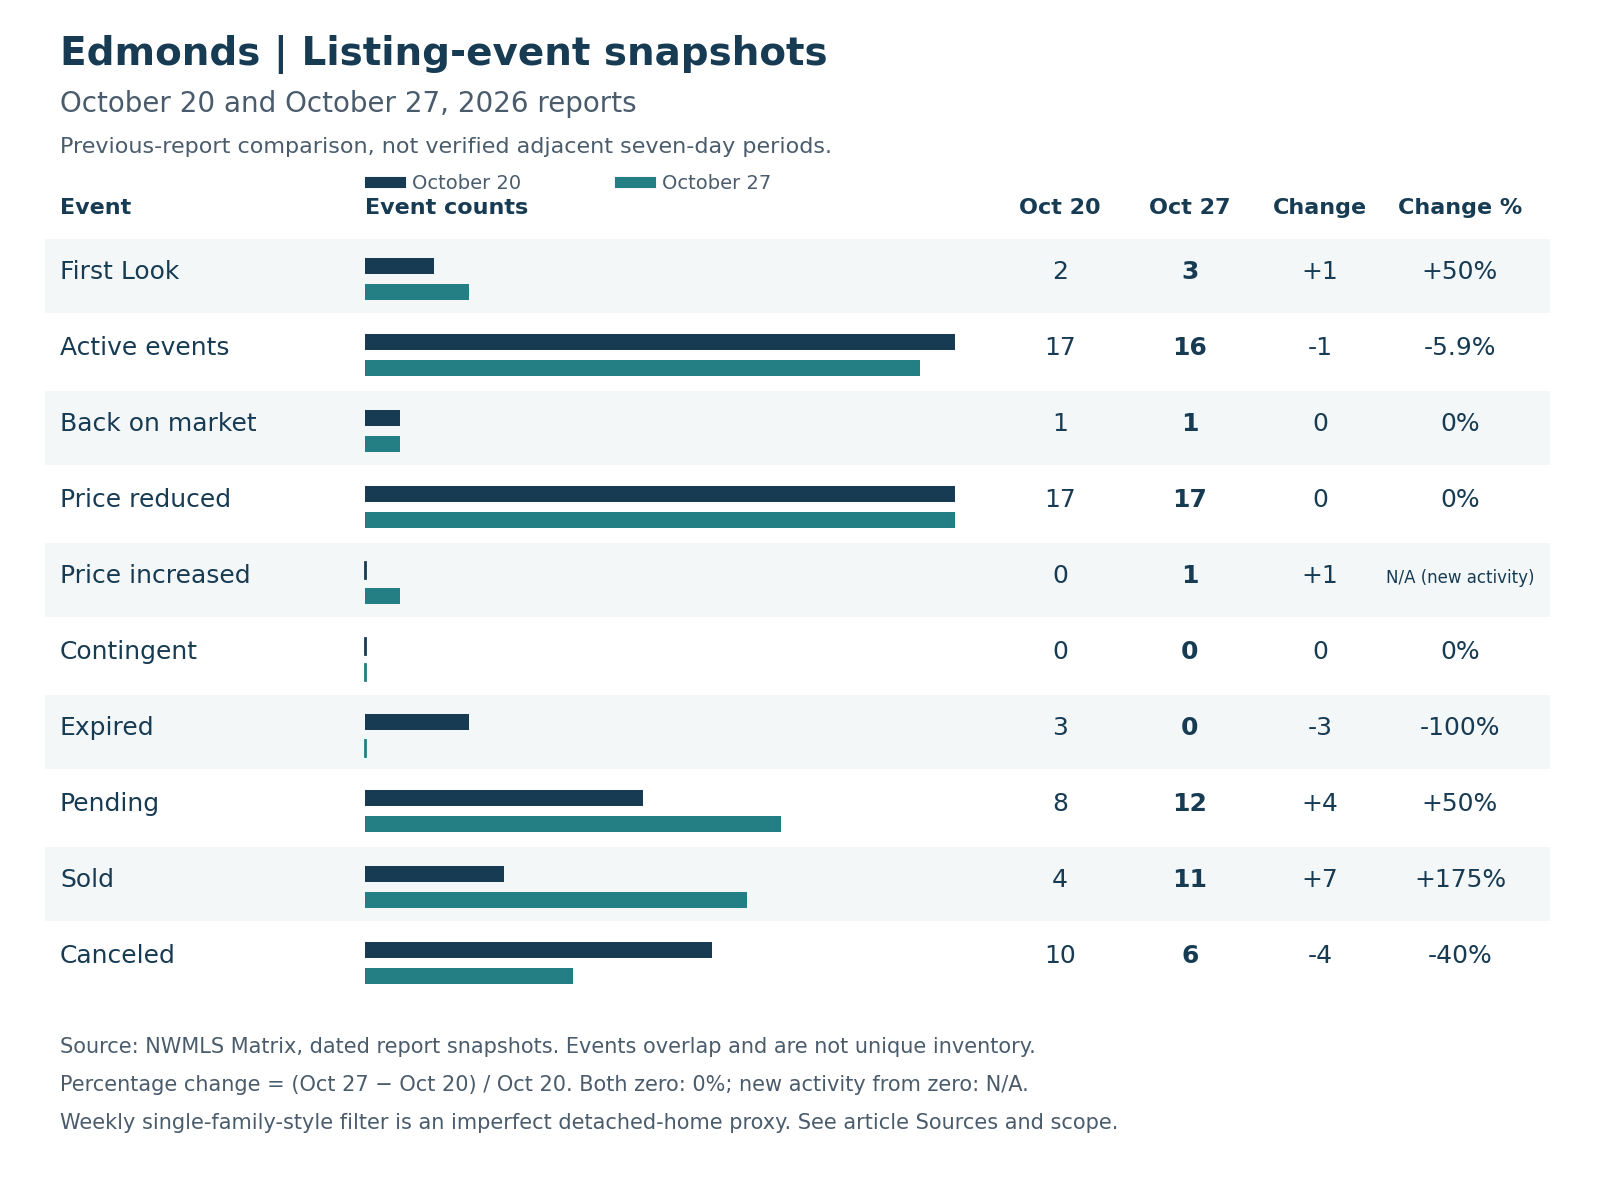
The October 27 snapshot recorded 12 pending events and 11 sold events, compared with 8 and 4 in our October 20 report. Price reductions remained at 17. Pending and sold counts were higher while price adjustments continued, so it is worth looking closely at the homes involved. These are comparisons with our October 20 report, not identical seven-day periods.
Open the large-text mobile chart
September Context For Your Decision
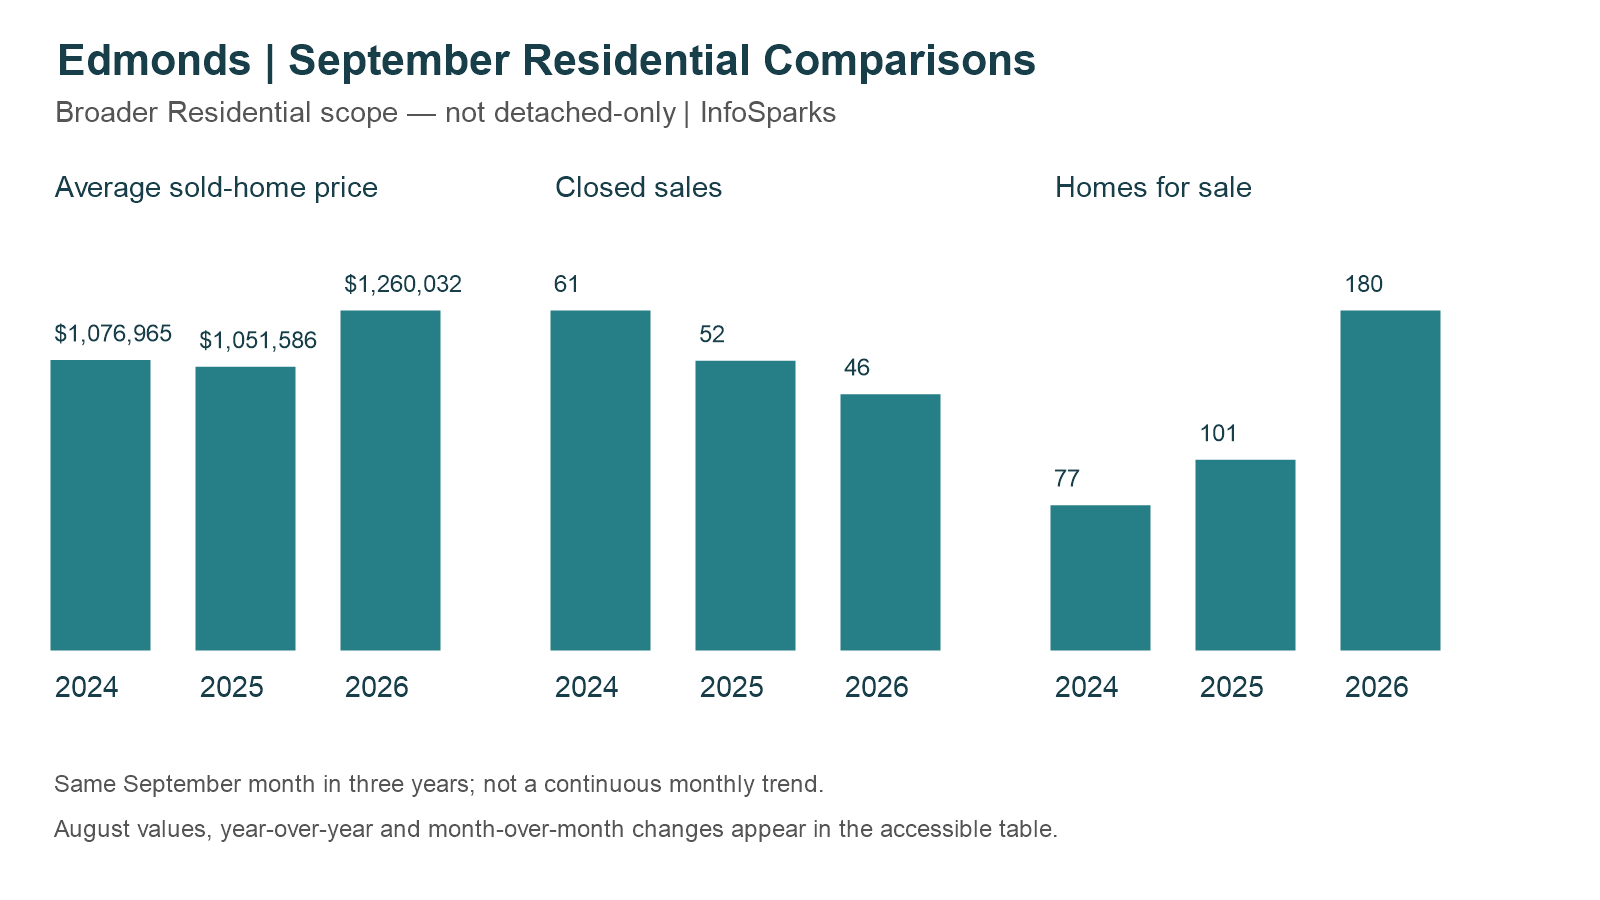
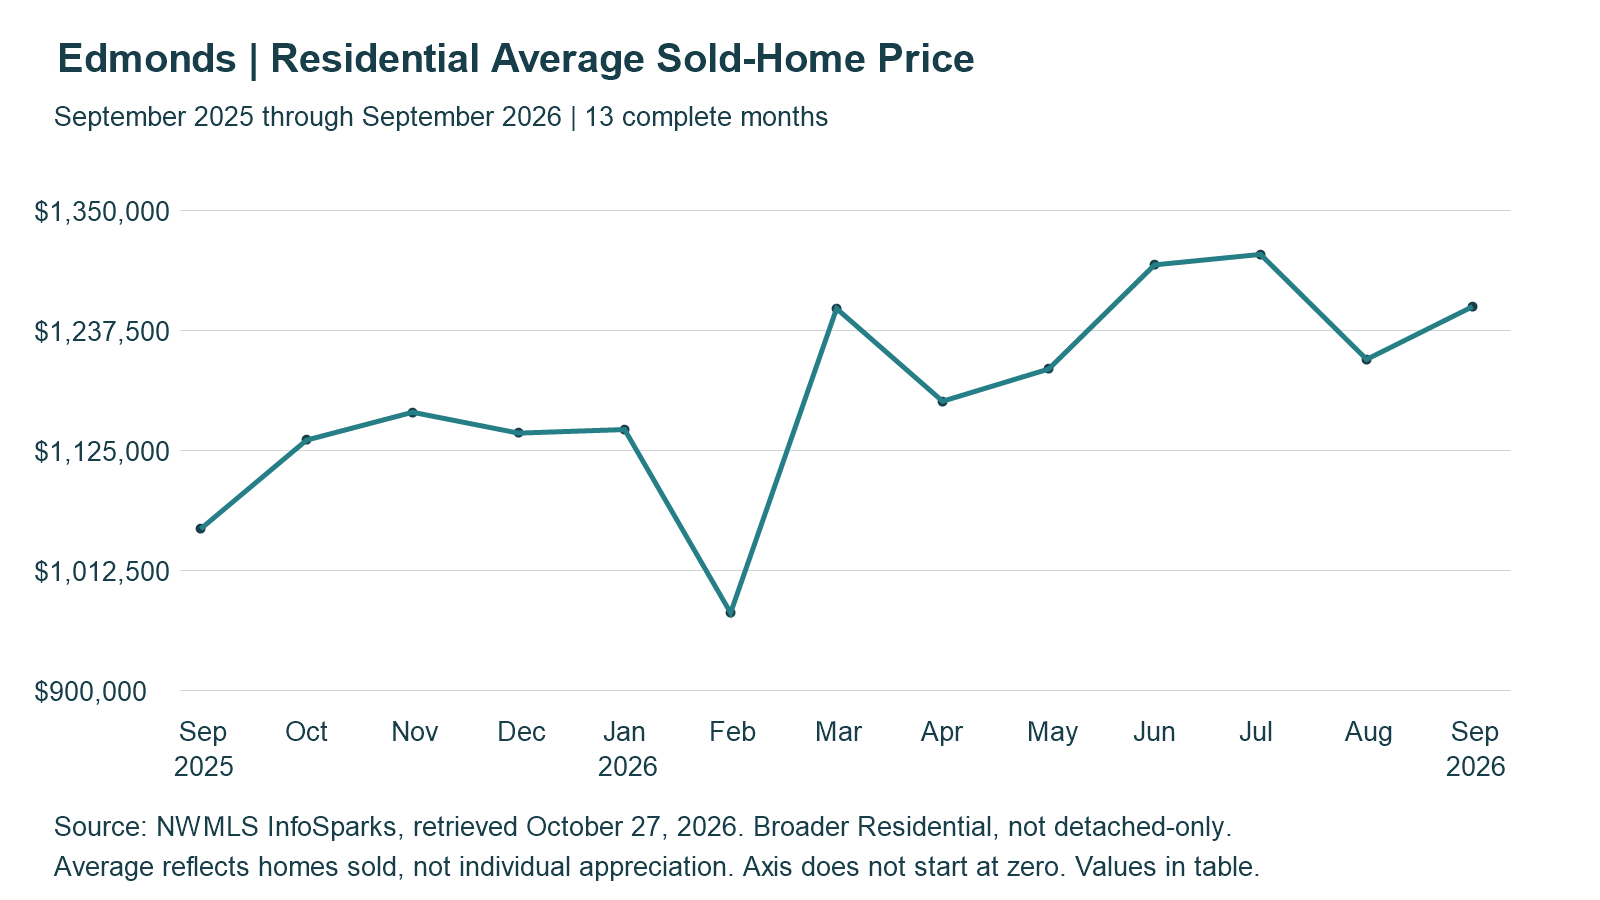
September's broader Residential homes for sale rose 78.2% year over year and closed sales fell 11.5%. Average sold-home price rose 19.8% year over year and 4.1% from August. Those mixed signals make the mix of homes sold particularly important: this is not a measure of appreciation for an individual property.
The Monthly Price Path
Rates And Your Monthly Payment
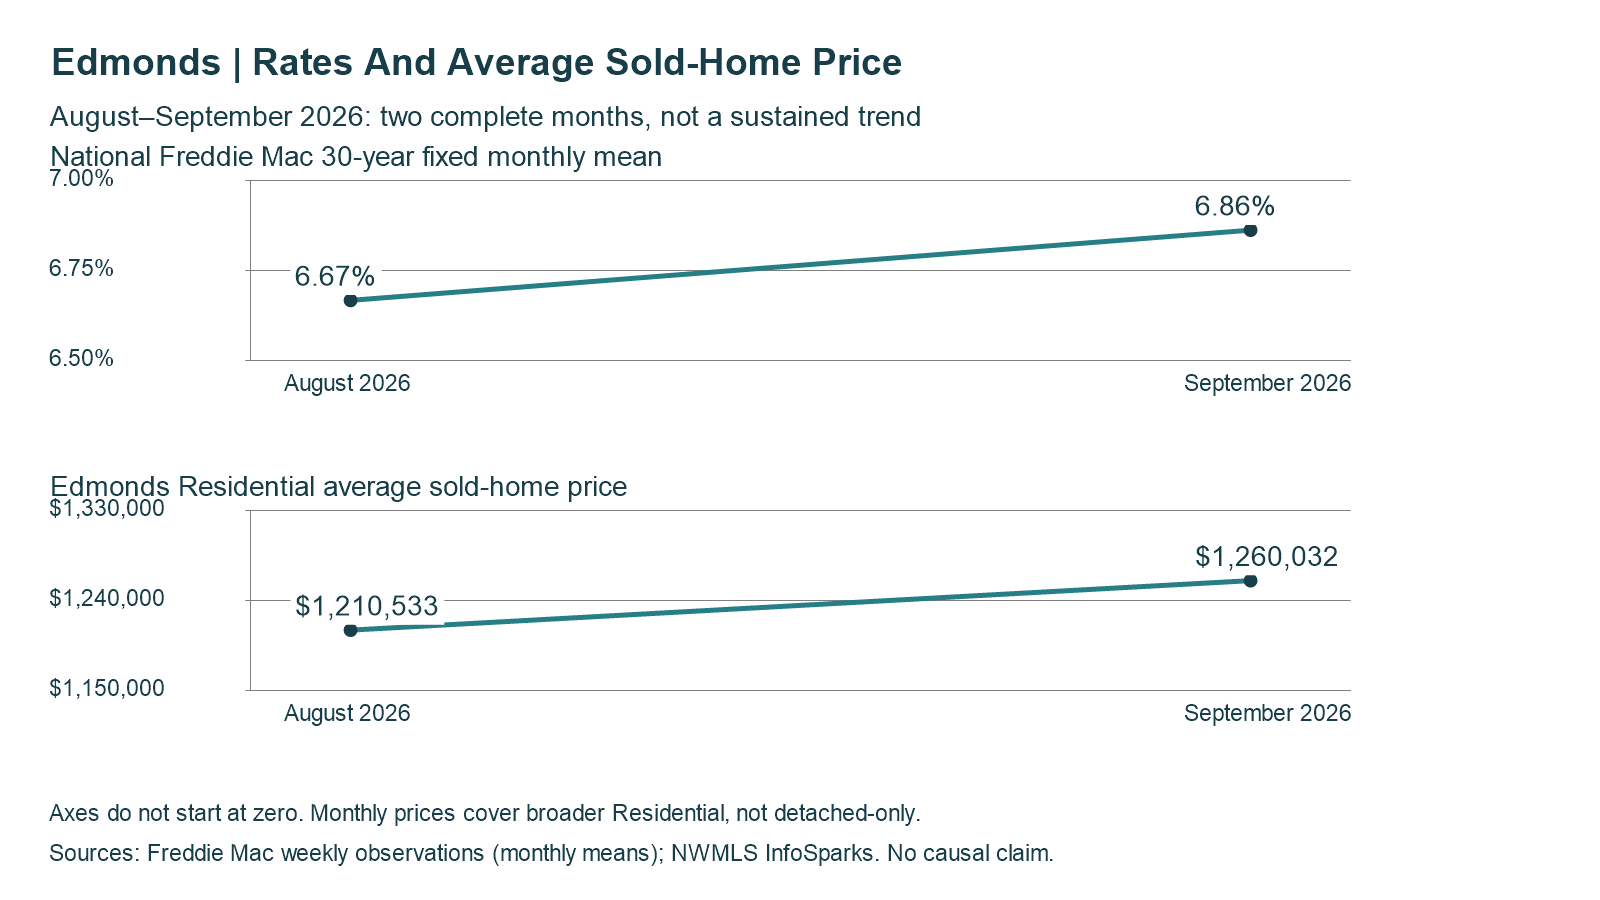
August and September 2026 only: a two-month comparison, not a sustained trend.
The national 30-year fixed weekly survey averaged 6.67% in August and 6.86% in September. Price is only one part of affordability: compare the payment for the home and financing available to you. These national series do not establish why local prices changed.
Mortgage-Rate Snapshot: October 26, 2026
The latest dated Mortgage News Daily observation checked for this report was October 26. These national index readings are context, not a lender quote or live widget. MND's daily index differs from Freddie Mac's weekly survey; the two methods and their rates are not interchangeable.
Loan type | Rate | Daily change (percentage points) |
|---|---|---|
30-year fixed | 7.33% | 0.00 |
15-year fixed | 6.99% | +0.01 |
30-year jumbo | 7.60% | 0.00 |
7/6 SOFR ARM | 6.82% | +0.07 |
30-year FHA | 6.96% | -0.02 |
30-year VA | 6.98% | -0.01 |
Current MND rate page | Daily rate movement and methodology
Questions Buyers And Sellers Ask
Does the average price tell me what my home is worth?
No. It describes the mix of homes that sold. Recent comparable sales, current competition, condition and location provide a more useful starting point for an individual home.
Do these weekly counts equal the number of homes available?
No. They count listing-status events in the source view, and a listing can appear in more than one category. Monthly homes-for-sale figures are a separate, broader Residential measure.
Click Below to View Listings
Active-Event Listings
Below are 12 working links from the 16 Active events in the October 27 report. They are not today's complete inventory; availability and status can change.
13505 58th Place W - MLS 2597927
5308 145th St SW - MLS 2587236
23919 97th Place W - MLS 2571666
8608 184th St SW - MLS 2590729
7002 177th St SW - MLS 2597240
11812 Marine View Dr - MLS 2597260
23927 80th Place W - MLS 2597595Pending as of November 3, 2026.
8629 202nd St SE - MLS 2596291
7715 236th St SW - MLS 2596867
7903 240th St SW - MLS 2596330
657 Walnut St - MLS 2586502Pending as of November 3, 2026.
First Look Listings
These 3 links match First Look events in the October 27 report. First Look is the source status at that time; see the dated status notes below.
8712 Talbot Rd - MLS 2593780Team NSRG: Active as of November 3, 2026.
4430 136 Place SW - MLS 2596622Redfin: First look as of November 3, 2026.
22317 W 96th Ave - MLS 2574263Redfin: First look as of November 3, 2026.
Making Your Next Move
Edmonds calls for a home-by-home plan. Buyers have more to compare, and sellers have good reason to make their home's value clear. I am happy to help you sort through the relevant alternatives and decide what these numbers mean for your move. - Jeremy
Contact Jeremy | Email | Call | Book a conversation
The Numbers Behind The Update
Listing event | October 20 report | October 27 report | Change | Change % |
|---|---|---|---|---|
First Look | 2 | 3 | +1 | +50% |
Active events | 17 | 16 | -1 | -5.9% |
Back on market | 1 | 1 | 0 | 0% |
Price reduced | 17 | 17 | 0 | 0% |
Price increased | 0 | 1 | +1 | N/A (new activity) |
Contingent | 0 | 0 | 0 | 0% |
Expired | 3 | 0 | -3 | -100% |
Pending | 8 | 12 | +4 | +50% |
Sold | 4 | 11 | +7 | +175% |
Canceled | 10 | 6 | -4 | -40% |
Period | Average sold-home price |
|---|---|
September 2024 | $1,076,965 |
September 2025 | $1,051,586 |
August 2026 | $1,210,533 |
September 2026 | $1,260,032 |
Year over year | +19.8% |
Month over month | +4.1% |
Period | Closed sales |
|---|---|
September 2024 | 61 |
September 2025 | 52 |
August 2026 | 52 |
September 2026 | 46 |
Year over year | -11.5% |
Month over month | -11.5% |
Period | Homes for sale |
|---|---|
September 2024 | 77 |
September 2025 | 101 |
August 2026 | 157 |
September 2026 | 180 |
Year over year | +78.2% |
Month over month | +14.6% |
Month | National 30-year fixed mean |
|---|---|
August 2026 | 6.6675% |
September 2026 | 6.8625% |
Month | Residential average sold-home price |
|---|---|
August 2026 | $1,210,533 |
September 2026 | $1,260,032 |
Month | Average sold-home price |
|---|---|
September 2025 | $1,051,586 |
October 2025 | $1,134,880 |
November 2025 | $1,160,976 |
December 2025 | $1,141,431 |
January 2026 | $1,144,795 |
February 2026 | $972,937 |
March 2026 | $1,258,178 |
April 2026 | $1,171,277 |
May 2026 | $1,201,481 |
June 2026 | $1,299,162 |
July 2026 | $1,309,000 |
August 2026 | $1,210,533 |
September 2026 | $1,260,032 |