
Bothell’s connection to the Sammamish River is part of what gives the city its character. Incorporated in 1909, Bothell now stretches across King and Snohomish counties, with a downtown where Main Street’s shops and restaurants sit close to the Park at Bothell Landing. The Sammamish River and Burke-Gilman trails offer room for a walk by the water or a longer bike ride, bringing outdoor recreation into everyday life. From its historic downtown to its parks and trails, there’s plenty to explore here. Now, let’s take a look at this week’s Bothell real estate market and what the latest numbers mean for buyers and sellers.
Team NSRG · Market notes · October 17, 2026
By Jeremy Minor
Bothell recorded 31 Active events and 22 Pending events in the NWMLS 7 Day view, alongside 34 price reductions. In the broader September Residential market, median price was $1,077,500, down 6.3% year over year and 3.1% from August.
The latest seven-day activity
Weekly scope: MLS-coded detached-home proxy: Residential, style codes 10–18, 25 and 26, excluding Building Information “Attached/Zero Lot Line,” all prices. This is not independent verification that every home is physically detached.
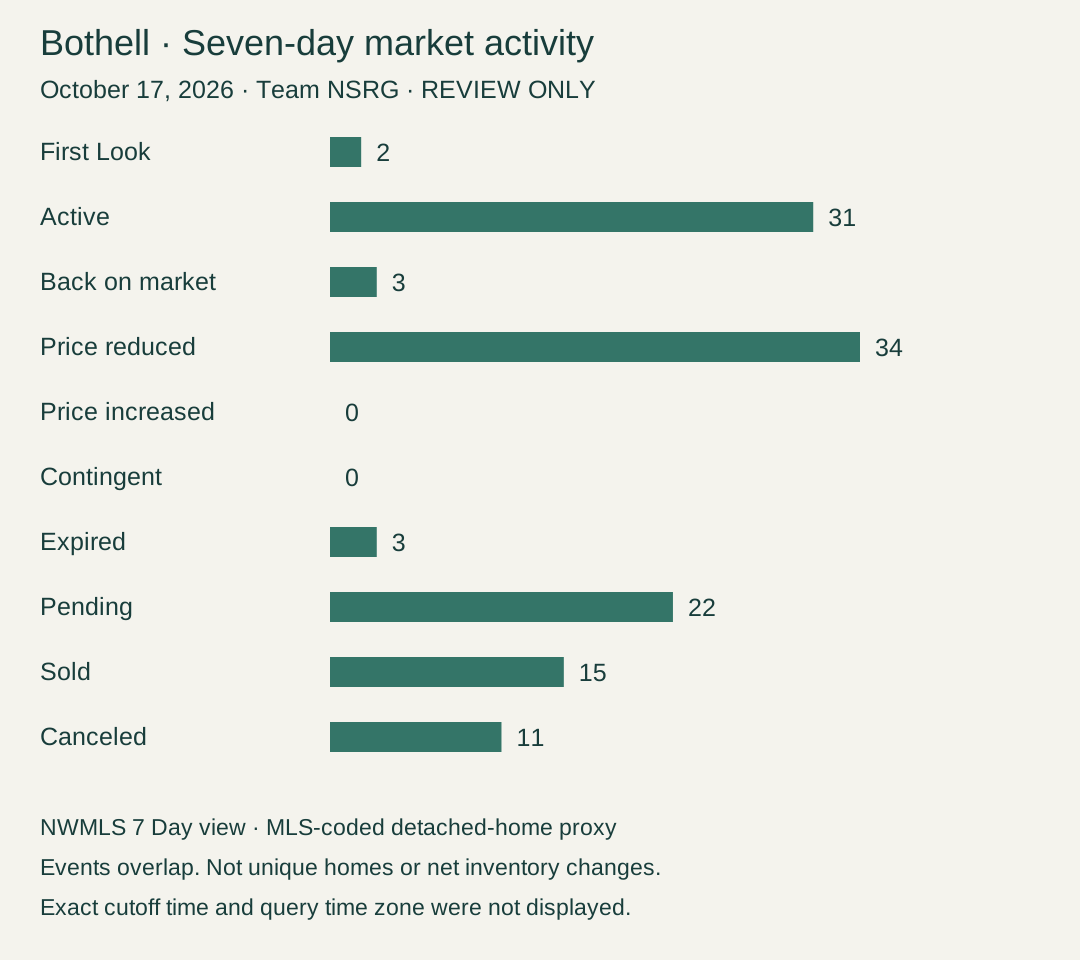
Event | Count |
|---|---|
First Look | 2 |
Active | 31 |
Back on market | 3 |
Price reduced | 34 |
Price increased | 0 |
Contingent | 0 |
Expired | 3 |
Pending | 22 |
Sold | 15 |
Canceled | 11 |
Categories overlap. A listing may have more than one event, and Active may include a First Look transition. These are not unique inventory counts, first-ever listings, or net inventory changes. Sold events may follow contracts from earlier periods.

September 2026: monthly context
Different scope: InfoSparks City Bothell, Residential, all styles and prices, with other filters unrestricted. This broader series may include attached homes and does not match the weekly detached-home proxy. September is the latest complete calendar month; October is incomplete.
September closed sales fell to 62 from 93 a year earlier, while homes for sale rose to 392 from 259. Median market time increased from 14 to 33 days. These measures support taking more care with pricing and current competition; they do not predict the outcome for a particular home.
Median sales price
Year over year: -6.3%
August 2026: $1,112,500
Month over month: -3.1%
Closed sales
Year over year: -33.3%
August 2026: 82
Month over month: -24.4%
Homes for sale
Year over year: +51.4%
August 2026: 400
Month over month: -2.0%
Median days on market
Year over year: +135.7%
August 2026: 15
Month over month: +120.0%
Months of supply (closed)
Year over year: +80.8%
August 2026: 4.6
Month over month: +2.2%
Metric | Sep 2026 | YoY | MoM |
|---|---|---|---|
Median sales price | $1,077,500 | -6.3% | -3.1% |
Closed sales | 62 | -33.3% | -24.4% |
Homes for sale | 392 | +51.4% | -2.0% |
Median days on market | 33 | +135.7% | +120.0% |
Months of supply (closed) | 4.7 | +80.8% | +2.2% |
The charts compare the same September month in three years; they are not a continuous monthly series. Months of supply uses the source’s closed-sales measure. Median days on market is not the average.
What to consider next
For sellers, compare current competing homes, condition and recent comparable sales before setting a price. For buyers, review price changes and the relevant local alternatives. Citywide measures are a starting point, not a valuation or a guarantee of negotiating leverage.
Sources, boundaries and reproducibility
Weekly filter: City Bothell; King and Snohomish; Residential; styles 10-18,25,26; NOT Attached/Zero Lot Line; Status not Incomplete; all prices; Washington. Geography follows the MLS City field rather than a separate municipal polygon. Unselected styles, including townhouse and manufactured-home styles, are excluded.
Both cities’ Active result criteria displayed “ChangeTypeHistory Modification Timestamp is 10/10/2026+.” The 7 Day selector runs through retrieval on October 17, 2026. Exact cutoff time and source query time zone were not displayed, so this is not a verified 168-hour interval or completed calendar week. The Active result boundary was checked for each city; separate event queries were not individually inspected.
Monthly September series capture began 2026-10-17T11:48:03.953000-07:00 (PDT); 2026-10-17T18:48:03.953Z (UTC). August comparison capture completed 2026-10-17T11:53:03.512000-07:00 (PDT); 2026-10-17T18:53:03.512Z (UTC). All five September 2026 values were also confirmed during the August chart checks. Data can change as records are revised.
NWMLS Market Watch · InfoSparks (member access). Retain these raw snapshots as the baseline. No previous-week percentage is shown because a matching adjacent window was not verified. Future comparisons beginning October 19 require the same scope and explicitly checked boundaries; overlapping 7 Day windows are not adjacent periods.