

Team NSRG | November 7, 2026
Bothell buyers have more homes to compare than they did a year ago. For sellers, that makes the homes competing for the same buyer especially important when setting a price and deciding what to prepare before going on the market.
If you're buying, I'd look closely at the condition, pricing history and terms of each home on your list. There may be room for a concession, but the best approach depends on the property and what the seller is trying to accomplish. If you're selling, give buyers a clear reason to choose your home and leave room in the plan for an honest conversation about price.
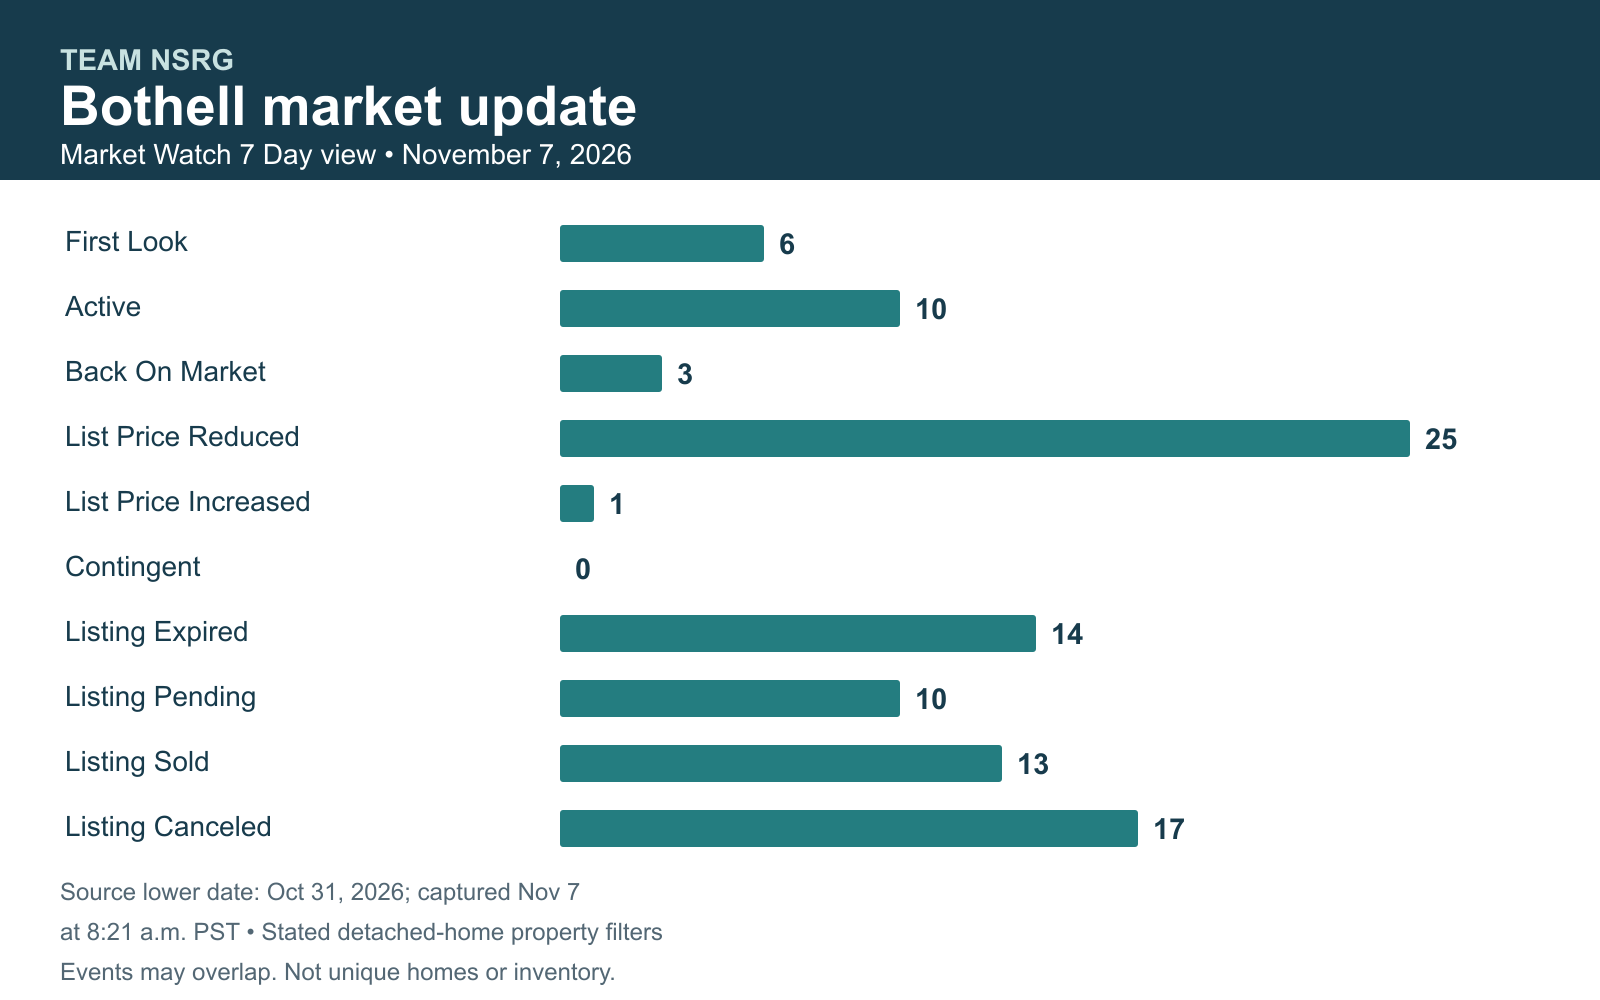
A look at this week's activity
Price reductions are a useful place to start that conversation. The latest Market Watch view shows adjustments alongside new activity, so I'd look at the details of a particular listing before drawing a conclusion about what its seller might accept.
October's broader market picture
October brought more available homes than the same month last year, while pending and closed sales were lower. The average sold price also came in below both September and October of last year. That gives us useful context for pricing, though the mix of homes that sold can move an average around.
The median time on market was shorter than in September, even with more supply than a year ago. A well-prepared home can still attract interest. I'd use the citywide figures as a starting point, then compare homes with a similar location, condition and price range.
Rates and average sales prices
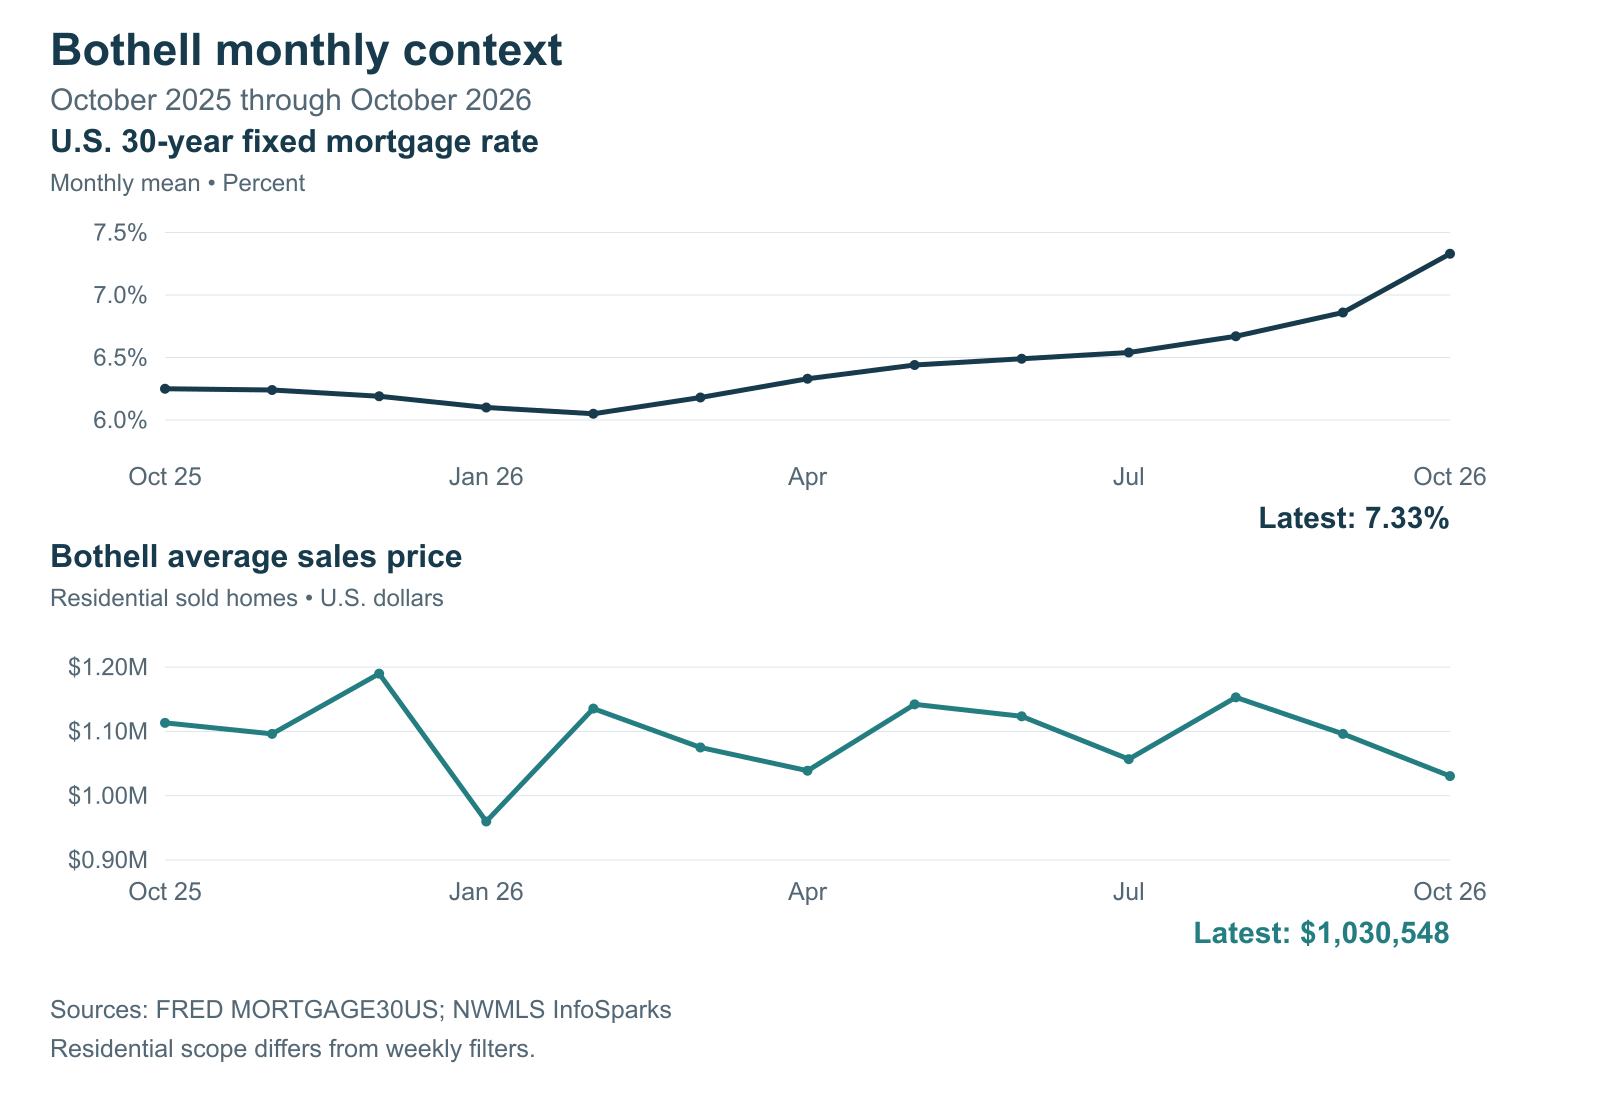
The monthly payment still matters. Before getting too attached to an asking price, it can help to talk through how the rate and the terms of an offer fit your budget. The chart keeps national rates and local sold prices on separate scales so each can be read clearly.
Mortgage-rate snapshot for November 6, 2026
Product | Rate | Daily change |
|---|---|---|
30-year fixed | 7.17% | 0.00 percentage points |
A dated national rate snapshot, not a personalized quote or APR. It is a different series from the monthly Freddie Mac/FRED chart.
View live Mortgage News Daily rates · View daily rate movement
Click Below to View Listings
Take a closer look at the homes represented in the Active and First Look groups. Availability can change, so let's confirm the current status before making plans.
Active listings
First Look Listings
First Look availability, showing timing and IDX display depend on seller-directed choices. Two links open on Redfin because a matching Team NSRG page was unavailable. Redfin displays Coming Soon, which is separate from the dated NWMLS First Look classification; public status and timing may differ. The 321-325 and 325 170th Place SE listings are related offerings and should not be treated as two distinct homes.
Listing pages originally checked November 7, 2026, 16:42-16:43 UTC and rechecked November 10. The links represent the November 7 snapshot; 3422 201st Place SE is now Pending. Availability can change.
What this means for your move
If you're thinking about buying or selling in Bothell, let's look at the homes you'd actually be competing with. From there, we can talk through price, preparation and where there may be room to negotiate.
Contact Jeremy Minor at Team NSRG
A couple of common questions
Does the change in average price tell me what my home is worth?
No. The average describes the homes that closed that month. A more useful starting point for your home is a set of recent, comparable sales, along with the properties a buyer can choose from today.
Can I add up the weekly counts to find the number of homes available?
No. These are status events. A home can appear in more than one category, including First Look and then Active. Available inventory is a separate measure.
View the weekly and monthly data
Status event | Count |
|---|---|
First Look | 6 |
Active | 10 |
Back On Market | 3 |
List Price Reduced | 25 |
List Price Increased | 1 |
Contingent | 0 |
Listing Expired | 14 |
Listing Pending | 10 |
Listing Sold | 13 |
Listing Canceled | 17 |
Metric | October 2025 | September 2026 | October 2026 | YoY | MoM |
|---|---|---|---|---|---|
Average Sales Price | $1,113,321 | $1,096,201 | $1,030,548 | -7.4% | -6.0% |
New Listings | 155 | 157 | 142 | -8.4% | -9.6% |
Homes for Sale | 272 | 389 | 385 | +41.5% | -1.0% |
Pending Sales | 86 | 71 | 68 | -20.9% | -4.2% |
Closed Sales | 96 | 62 | 76 | -20.8% | +22.6% |
Median Days on Market | 22 | 33 | 22 | 0.0% | -33.3% |
Months Supply of Inventory (Closed) | 2.8 | 4.6 | 4.7 | +67.9% | +2.2% |
Median Percent of Last List Price | 100.0% | 98.0% | 98.7% | -1.3 pp | +0.7 pp |
YoY compares October 2026 with October 2025. MoM compares October with September 2026. Changes are percentages except the last-list-price ratio, shown in percentage points (pp).
30-year fixed rate
Month | 30-year fixed rate |
|---|---|
October 2025 | 6.25% |
November 2025 | 6.24% |
December 2025 | 6.19% |
January 2026 | 6.10% |
February 2026 | 6.05% |
March 2026 | 6.18% |
April 2026 | 6.33% |
May 2026 | 6.44% |
June 2026 | 6.49% |
July 2026 | 6.54% |
August 2026 | 6.67% |
September 2026 | 6.86% |
October 2026 | 7.33% |
Average sales price
Month | Average sales price |
|---|---|
October 2025 | $1,113,321 |
November 2025 | $1,096,176 |
December 2025 | $1,189,875 |
January 2026 | $959,923 |
February 2026 | $1,135,560 |
March 2026 | $1,075,034 |
April 2026 | $1,038,861 |
May 2026 | $1,142,111 |
June 2026 | $1,123,512 |
July 2026 | $1,056,834 |
August 2026 | $1,153,023 |
September 2026 | $1,096,201 |
October 2026 | $1,030,548 |
Sources and scope
Weekly: authenticated NWMLS Matrix Market Watch, Single Family, 7 Day, City Bothell; Washington; King and Snohomish counties. Residential subtype; style codes 10, 11, 12, 13, 14, 15, 16, 17, 18, 25 and 26; Building Information excludes Attached/Zero Lot Line; Status excludes Incomplete. No price, year, map, MLS area, community, ZIP or broker limits. The displayed date criterion was 10/31/2026+; capture November 7, 2026 at 8:21:30 a.m. PST (2026-11-07T16:21:30.402Z). Source intraday endpoints and field timezone were not exposed, so this is not a verified rolling 168-hour period. The October 31 report was checked. It uses cross-referenced Hot Sheet status events for October 24–30, with different coverage and separate pending categories, rather than this Market Watch view. Those counts are not an equivalent baseline, so no week-over-week percentage change is shown. Status-event counts may overlap.
Monthly: NWMLS InfoSparks, City Bothell, Residential, Monthly, 3 Years, with all other filters neutral. Latest complete month October 1–31, 2026; comparisons September 1–30, 2026 and October 1–31, 2025. Data vintage November 7, 2026; source exports downloaded 16:30:57–16:33:11 UTC. Residential is broader than the weekly detached-home property filters. Average prices reflect the homes sold, not same-home appreciation. Historical figures may be revised.
Monthly rates: FRED MORTGAGE30US / Freddie Mac PMMS, United States, percent, not seasonally adjusted; calendar-month arithmetic mean of weekly observations ending Thursday; October 2025–October 2026. Retrieved November 7, 2026 at 16:26 UTC. Mortgage News Daily snapshot: November 6, 2026 observation, retrieved November 7 at 16:25 UTC. Daily and monthly series have different methodologies and are not interchangeable.